kevint
June 11, 2023, 8:59am
1
Hi,
first query:
import "date"
from(bucket: "iobroker")
  |> range(start: v.timeRangeStart, stop: v.timeRangeStop)
  |> filter(fn: (r) => r._measurement == "openknx.0._BC__Buero_Christian.Verbraucher._BC__Ver___PC_-_Wirkleistung" and r._field == "value")
  |> map(fn: (r) => ({r with hour: date.hour(t: r._time) } ))
  |> group(columns: ["hour"], mode:"by")
  |> mean()
  |> group()
  |> sort(columns:["hour"])
  |> map(fn: (r) => ({r with hour_txt: string(v: r.hour)}))
  |> drop(columns: ["hour"])
  |> yield(name:"PC CH")
second query:
import "date"
from(bucket: "iobroker")
  |> range(start: v.timeRangeStart, stop: v.timeRangeStop)
  |> filter(fn: (r) => r._measurement == "openknx.0._BT__Buero_Tinka.Verbraucher._BT__Ver___PC_-_Wirkleistung" and r._field == "value")
  |> map(fn: (r) => ({r with hour: date.hour(t: r._time) } ))
  |> group(columns: ["hour"], mode:"by")
  |> mean()
  |> group()
  |> sort(columns:["hour"])
  |> map(fn: (r) => ({r with hour_txt: string(v: r.hour)}))
  |> drop(columns: ["hour"])
  |> yield(name: "PC TI")
As soon as I disable one of the queries the other one will be displayed.
What am I doing wrong?
Best regards,
grant2
June 11, 2023, 8:38pm
2
Hi @kevint
Looks like you have two different measurements, but the rest of the fields / tags are the same. Is that correct? If yes, simply separate the two measurements with or like this:
import "date"
from(bucket: "iobroker")
  |> range(start: v.timeRangeStart, stop: v.timeRangeStop)
  |> filter(fn: (r) => r._measurement == "openknx.0._BC__Buero_Christian.Verbraucher._BC__Ver___PC_-_Wirkleistung" or r._measurement == "openknx.0._BT__Buero_Tinka.Verbraucher._BT__Ver___PC_-_Wirkleistung")
  |> filter(fn: (r) => r["_field"] == "value")
  |> map(fn: (r) => ({r with hour: date.hour(t: r._time) } ))
  |> group(columns: ["hour"], mode:"by")
  |> mean()
  |> group()
  |> sort(columns:["hour"])
  |> map(fn: (r) => ({r with hour_txt: string(v: r.hour)}))
  |> drop(columns: ["hour"])
  |> yield(name: "PC TI")
kevint
June 12, 2023, 6:04pm
3
Hi @grant2 ,
grant2
June 13, 2023, 9:50am
4
Hi @kevint Yes, you should get one graph, which I thought was your goal when you wrote “display two queries in one bar chart”.
Did you try this yet in Grafana, and if yes, what was the result?
kevint
June 13, 2023, 4:46pm
5
Hi @grant2 ,
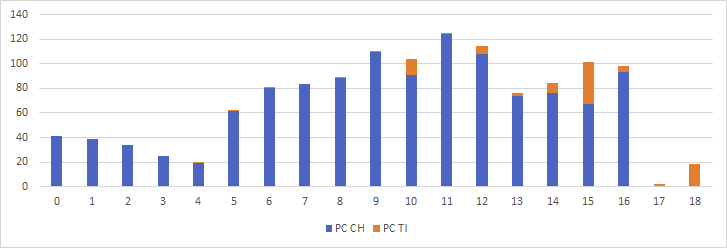
Now it is as expected: The sum of both values:
What I would like to have is bars in one bar chart:
kevint
June 14, 2023, 7:04pm
6
Hi,
import "date"

from(bucket: "iobroker")
  |> range(start: v.timeRangeStart, stop: v.timeRangeStop)
  |> filter(fn: (r) => r["_measurement"] == "openknx.0._BC__Buero_Christian.Verbraucher._BC__Ver___PC_-_Wirkleistung" or r["_measurement"] == "openknx.0._BT__Buero_Tinka.Verbraucher._BT__Ver___PC_-_Wirkleistung")
  |> filter(fn: (r) => r["_field"] == "value")
  |> map(fn: (r) => ({r with hour: date.hour(t: r._time) } ))
  |> group(columns: ["_measurement","hour"], mode:"by")

  |> sum()
  |> group()
  |> map(fn: (r) => ({r with hour_txt: string(v: r.hour)}))
  |> drop(columns: ["hour"])
  |> pivot(rowKey: ["hour_txt"], columnKey:["_measurement"], valueColumn:"_value")
I still dont understand why using two queries did not work.

