Updated to clarify.
I am using Grafana v11.6.5 on Windows
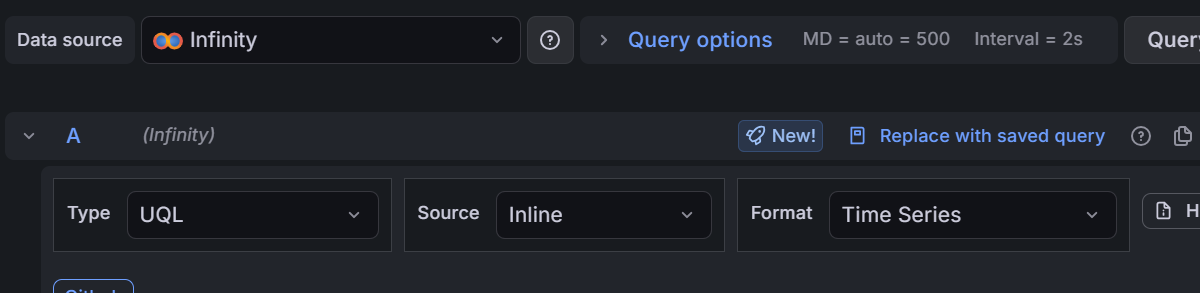
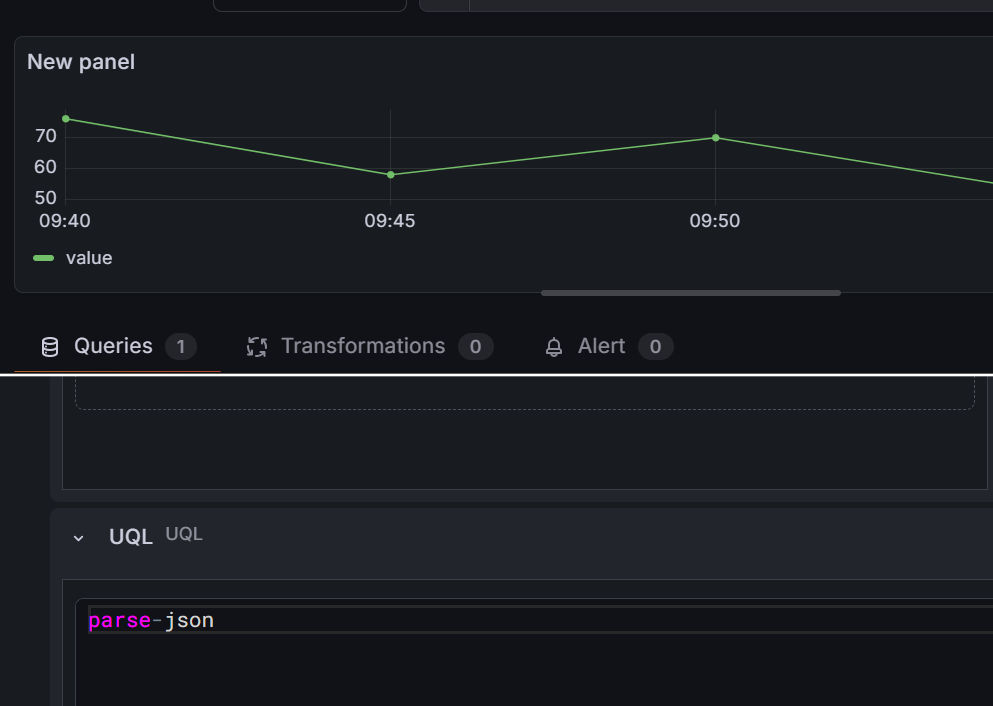
I am attempting to pull data from the PRTG API using the Infinity plugin. I have this part working. I want to format the data into a Time Series to create a CPU over time visualization. I found some articles and believe the format below is correct. The visualization continues to provide a message “Data is missing a time field“ Any suggestions?
I am using JSONata to convert the PRTG API response into the above format.
PRTG API Response
{"prtg-version":"XX.XX.XX","treesize":12,"values":[{"datetime":"10/17/2025 10:00:00 AM - 10:05:00 AM","Total":60.0000,"Processor 1":53.0000,"Processor 2":69.0000,"Processor 3":63.0000,"Processor 4":63.0000,"Processor 5":55.0000,"Processor 6":51.0000,"Processor 7":61.0000,"Processor 8":68.0000,"Downtime":0.0000},{"datetime":"10/17/2025 9:55:00 AM - 10:00:00 AM","Total":53.0000,"Processor 1":40.0000,"Processor 2":66.0000,"Processor 3":54.0000,"Processor 4":61.0000,"Processor 5":46.0000,"Processor 6":41.0000,"Processor 7":54.0000,"Processor 8":65.0000,"Downtime":0.0000},{"datetime":"10/17/2025 9:50:00 AM - 9:55:00 AM","Total":70.0000,"Processor 1":62.0000,"Processor 2":77.0000,"Processor 3":71.0000,"Processor 4":71.0000,"Processor 5":68.0000,"Processor 6":65.0000,"Processor 7":70.0000,"Processor 8":75.0000,"Downtime":0.0000},{"datetime":"10/17/2025 9:45:00 AM - 9:50:00 AM","Total":58.0000,"Processor 1":47.0000,"Processor 2":68.0000,"Processor 3":59.0000,"Processor 4":61.0000,"Processor 5":53.0000,"Processor 6":49.0000,"Processor 7":60.0000,"Processor 8":68.0000,"Downtime":0.0000},{"datetime":"10/17/2025 9:40:00 AM - 9:45:00 AM","Total":76.0000,"Processor 1":70.0000,"Processor 2":81.0000,"Processor 3":79.0000,"Processor 4":79.0000,"Processor 5":72.0000,"Processor 6":74.0000,"Processor 7":78.0000,"Processor 8":79.0000,"Downtime":0.0000}]}
JSONata function
$map(values, function($p){
{
“time”: $fromMillis($toMillis($substringBefore($p.datetime, " - "), “[M01]/[D01]/[Y0001] [h#1]:[m01]:[s01] [P]”), “[H01]:[m01]”),
“value”: $p.Total
}
})
Results
[
  {
    "time": "2025-10-17T10:00:00Z",
    "value": 60
  },
  {
    "time": "2025-10-17T09:55:00Z",
    "value": 53
  },
  {
    "time": "2025-10-17T09:50:00Z",
    "value": 70
  },
  {
    "time": "2025-10-17T09:45:00Z",
    "value": 58
  },
  {
    "time": "2025-10-17T09:40:00Z",
    "value": 76
  }
]