-
v11.5.2
-
I’m trying to have a time series panel adjust its time frame for the data contained.
-
Using a timeseries panel with a repeat option using a variable $POlist.
-
I’m hoping that each panel refines its date range according to the data contained within it.
-
MS SQL backend
Hi All,
I have read many topics now and none have really help me with my issue. I have been using Grafana for 5+ years now and I am a bit stumped with this particular problem, looking for some help!
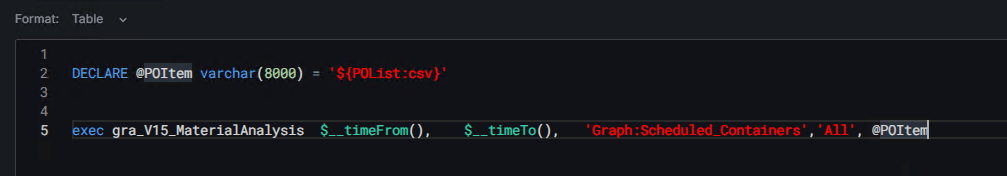
Basically I have a dashboard that has a variable called $POList, this is populated with a list of Process Orders operated over the date range selected, in my example a year. Lets say there are 10 PO’s returned by this variable. I then have a time series panel that will repeat based upon this $POList variable. The MS SQL back end is collecting the data correctly and all of this is working well.
However, my issue is with the presentation of each of these repeated panels. The PO operations may only last a week or 2 or even 6 weeks and at different irregular times of the year. And I’m finding that each repeated panel is showing the full year date range rather than showing what data is contained within. See my screenshots for how it looks currently and I’ve added what I attempting each of the panels to look like. For the ‘correct’ image I had to refine the dates specific to that PO Item which removes all the other PO’s from my list which isn’t ideal. Is there any way to override a panel’s date time relationship to the dashboards date selection and set the start date to the first record and the end date to the last record’s date?
I’ve provided a sample of records for 1 panel below.