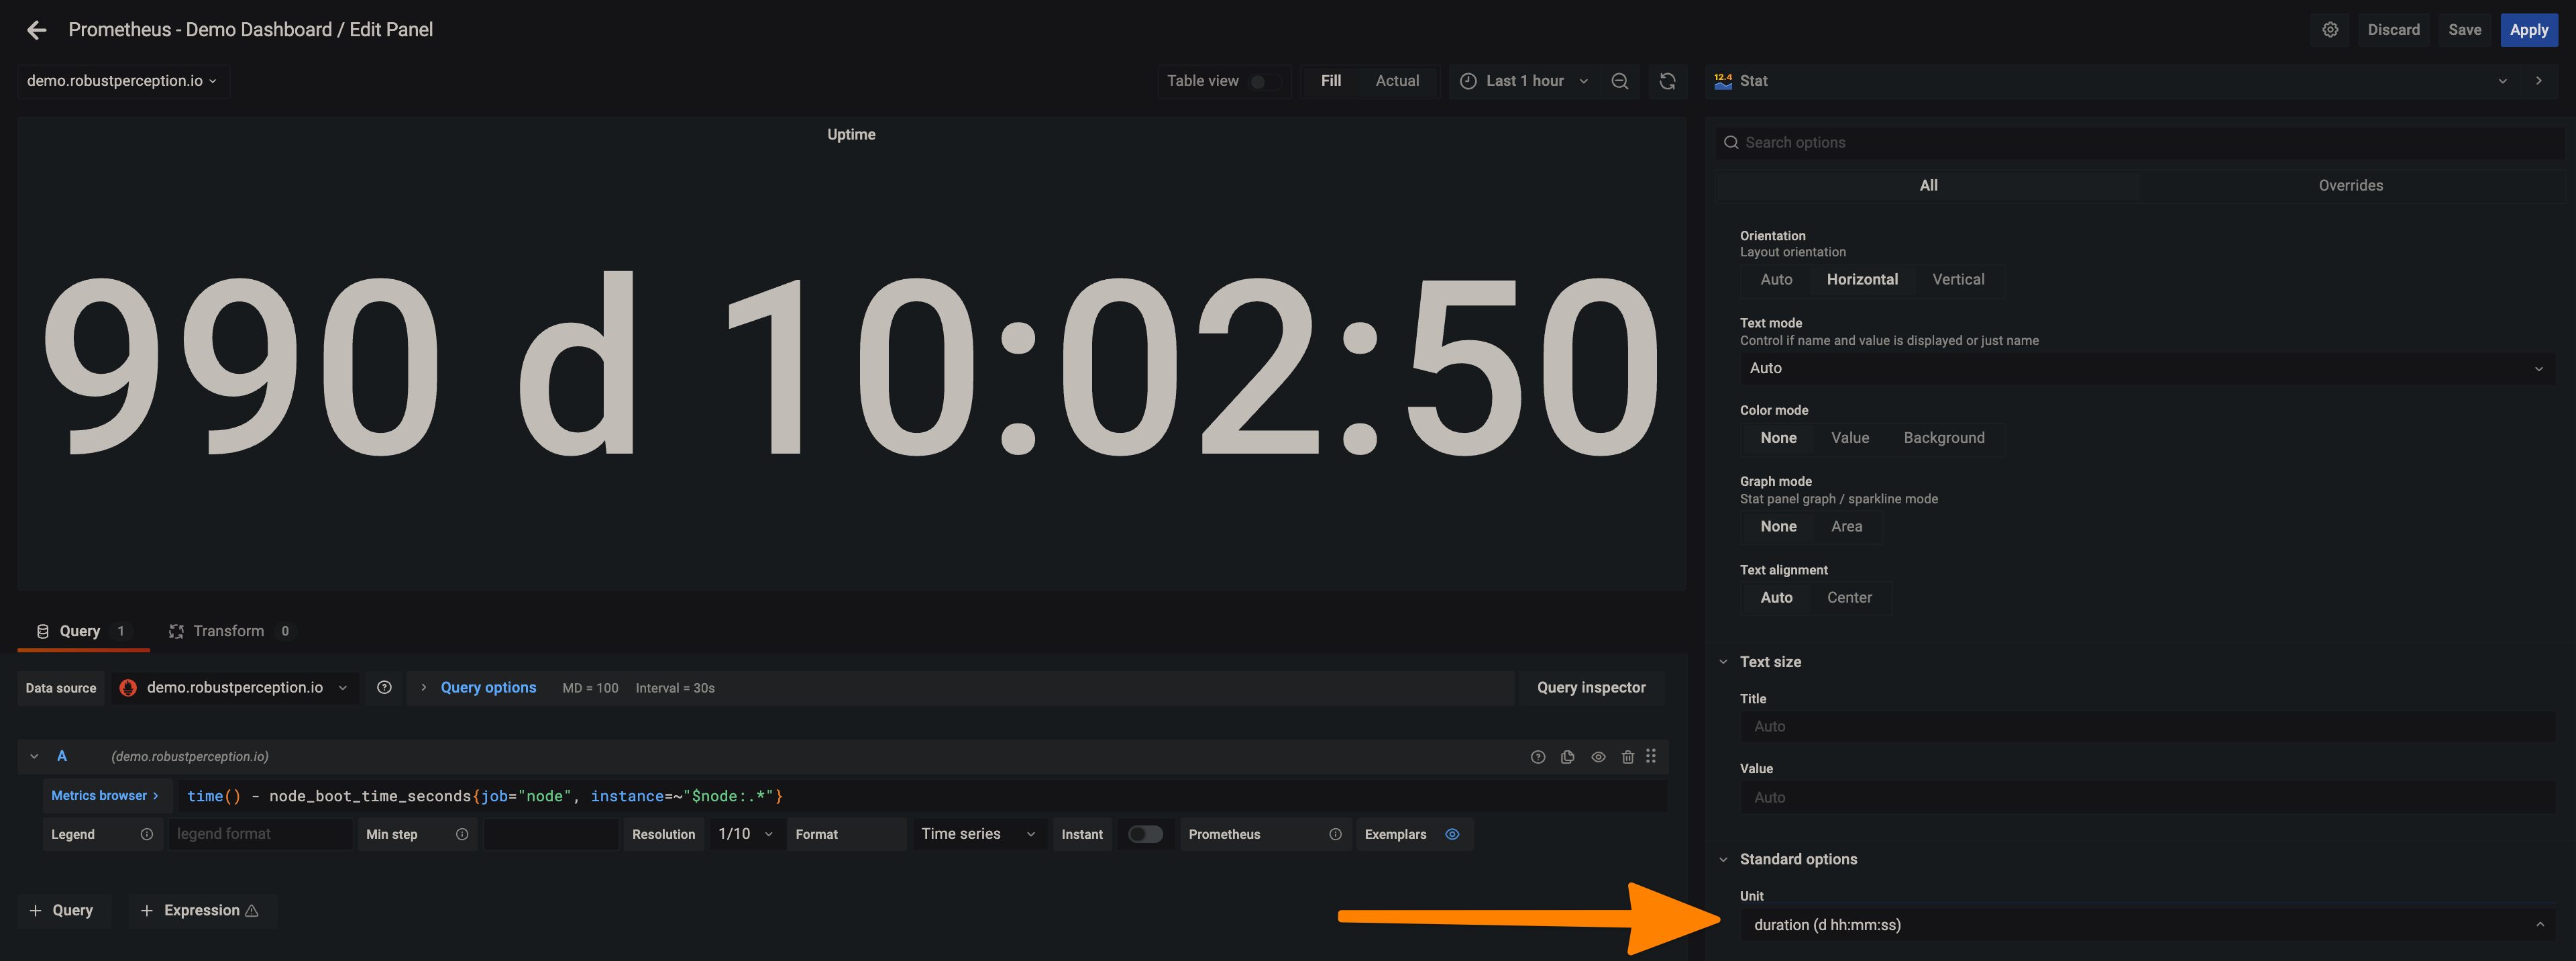
If the system uptime is 3days and 12 hrs right the single stat shows it as 3days in Grafana.
There are options like 3d 12:00:00 or format like hh:mm.ss or d:hh:mm.ss
can we show the uptime format as 3days and 12 hrs.
Hello ![]() and welcome to the forum, @criminallygood0
and welcome to the forum, @criminallygood0
have you tried adjusting the unit value in the panel editor?
this is on Grafana 8.2.2
This topic was automatically closed after 365 days. New replies are no longer allowed.