-
What Grafana version and what operating system are you using?
- Grafana 11.4
- Accessing from Windows 11 using Chrome
- Prometheus Data Source
- Query: avg by (edge_name) (ngwan_qoe_reporter_qoe{traffic_type=“$QoEType”, edge_name=~“$Edges”})
- ngwan_qoe_reporter_qoe is a gauge metric with values between 1.0 and 10.0
- $QoEType is a variable for a string label having 4 values. Only one value is selected at a time.
- $Edges is a variable for a string label that can have many values. One or more of these are selected at a time.
-
What are you trying to achieve?
- Have a table panel where each series (edge_name) is represented, not just one series, which is what you get by default in a Table
-
How are you trying to achieve it?
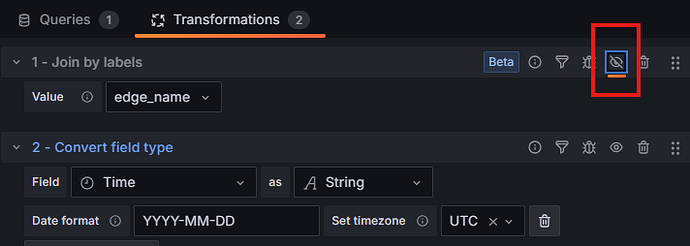
- I’ve successfully gotten a column per edge_name, but that transformation has removed the _time column.
-
What happened?
- The Time column is removed by this transformation
-
What did you expect to happen?
- The Time column would remain, or at least be available to add back.
-
Can you copy/paste the configuration(s) that you are having problems with?
-
Did you receive any errors in the Grafana UI or in related logs? If so, please tell us exactly what they were.
- No errors, per se. If I add a second transformation below the “Join by labels” of type “Convert field type” and then I activate and deactivate the “Join by labels” transform, I get with Field: Time, or Field: Time (not found).
-
Did you follow any online instructions? If so, what is the URL?
- No particular page. A lot of AI Chat bot questions. Apparently this transform has changed A LOT in recent versions.

