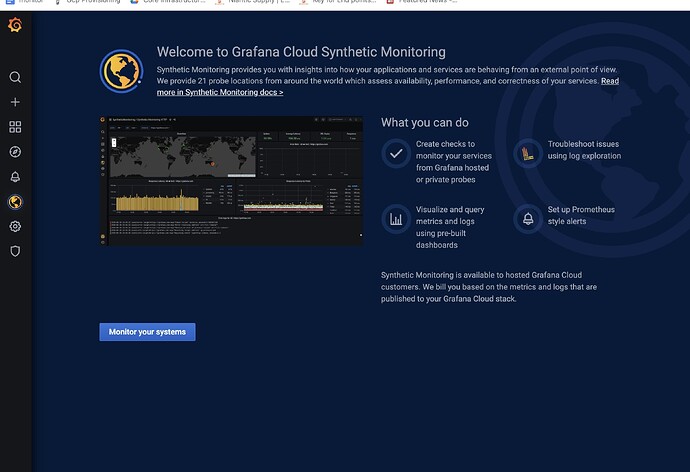
Hey Grafana team!
I got a problem when initializing the Synthetic monitoring plugin in a local instance (it’s on kubenetes). I found this post https://community.grafana.com/t/synthetic-monitoring-on-local-grafana-instance/59947/12 really helpful, so basically I followed all the steps there
The plugin version I’m using is 0.10.2, and grafana is 7.5.1. The two data sources (prometheus and Loki) were set up manually in Grafana console, and they’re in green when testing. And here’s my provision file for the sm plugin:
apiVersion: 1

    apps:
      - type: grafana-synthetic-monitoring-app
        name: grafana-synthetic-monitoring-app
        disabled: false
        jsonData:
          apiHost: https://synthetic-monitoring-api.grafana.net
          stackId: 412137
          logs:
            grafanaName: grafanacloud-apigatewaydev-logs
            hostedId: 261476
          metrics:
            grafanaName: grafanacloud-apigatewaydev-prom
            hostedId: 525012
        secureJsonData:
          publisherToken: eyJrIj.........
Here’s the page looks like now:
But after I clicked the “monitor your system” button, there’s no change to the page, and there’s a 404 record in the browser console:
Request URL: https://api-gateway-graf.eng.....com/a/grafana-synthetic-monitoring-app/?page=setup
Request Method: GET
Status Code: 404
Could you help me with it? Many thanks!
