more i cant find in the debugging,
i can paste the Json Model panel:
{
“aliasColors”: {},
“bars”: false,
“datasource”: “PAC BACKUP”,
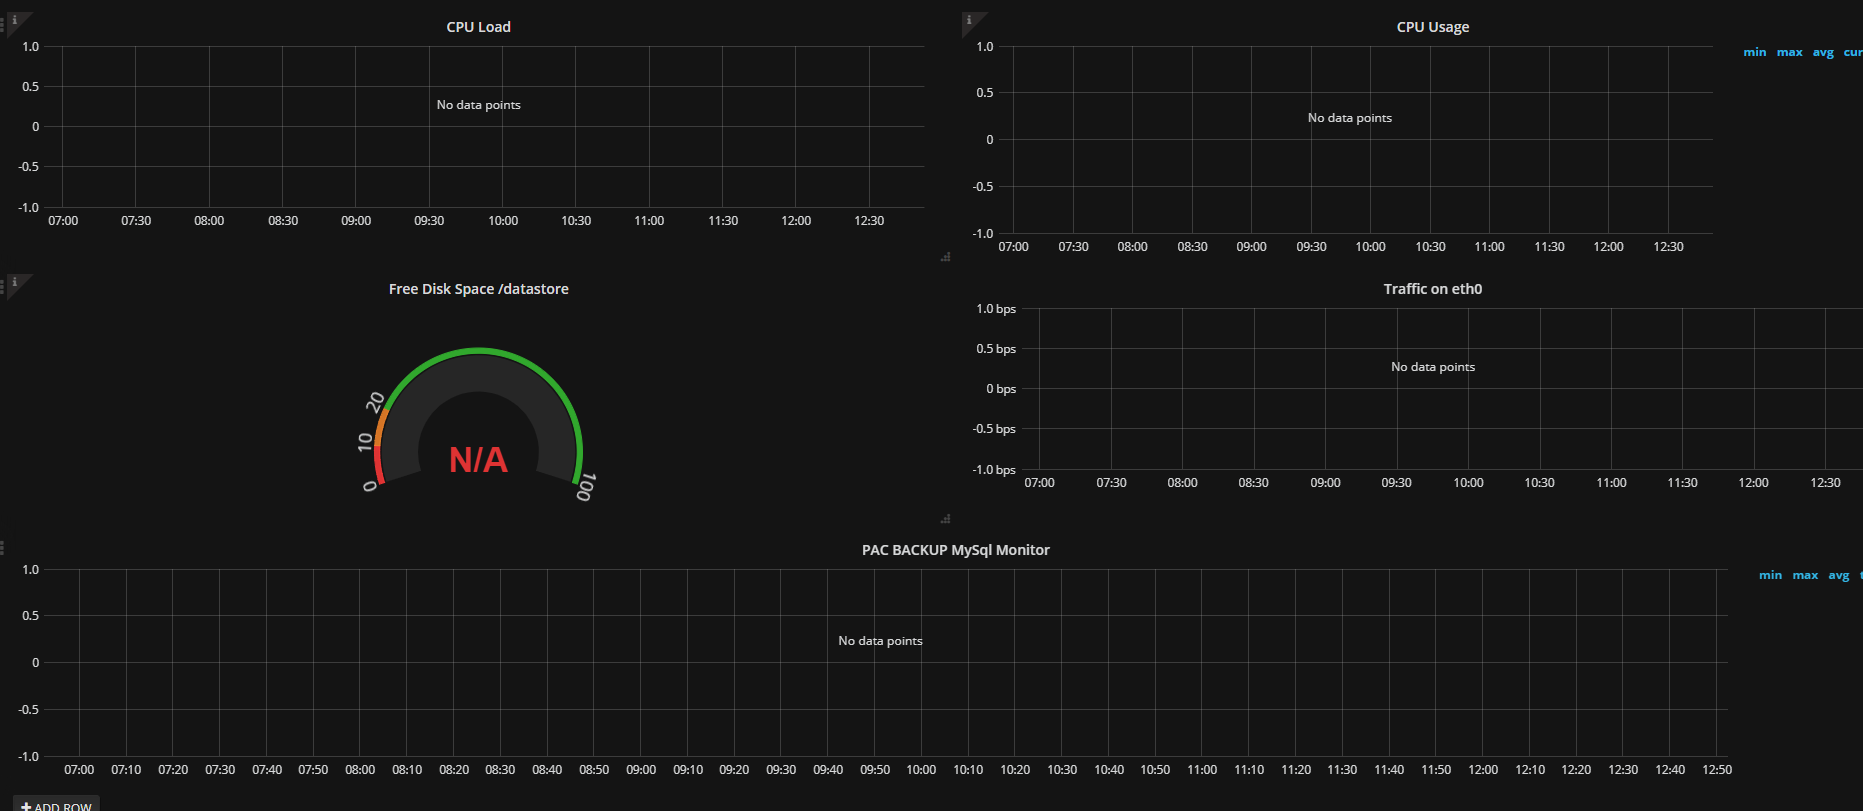
“description”: “cpu load zabbix server”,
“fill”: 1,
“id”: 1,
“legend”: {
“avg”: false,
“current”: false,
“max”: false,
“min”: false,
“show”: true,
“total”: false,
“values”: false
},
“lines”: true,
“linewidth”: 1,
“links”: ,
“nullPointMode”: “null”,
“percentage”: false,
“pointradius”: 5,
“points”: false,
“renderer”: “flot”,
“seriesOverrides”: ,
“span”: 6,
“stack”: false,
“steppedLine”: false,
“targets”: [
{
“application”: {
“filter”: “CPU”
},
“functions”: ,
“group”: {
“filter”: “Zabbix servers”
},
“host”: {
“filter”: “Zabbix server”
},
“item”: {
“filter”: “Processor load (1 min average per core)”
},
“mode”: 0,
“options”: {
“showDisabledItems”: false
},
“refId”: “A”
},
{
“application”: {
“filter”: “CPU”
},
“functions”: ,
“group”: {
“filter”: “Zabbix servers”
},
“host”: {
“filter”: “Zabbix server”
},
“item”: {
“filter”: “Processor load (5 min average per core)”
},
“mode”: 0,
“options”: {
“showDisabledItems”: false
},
“refId”: “B”
},
{
“application”: {
“filter”: “CPU”
},
“functions”: ,
“group”: {
“filter”: “Zabbix servers”
},
“host”: {
“filter”: “Zabbix server”
},
“item”: {
“filter”: “Processor load (15 min average per core)”
},
“mode”: 0,
“options”: {
“showDisabledItems”: false
},
“refId”: “C”
}
],
“thresholds”: ,
“timeFrom”: null,
“timeShift”: null,
“title”: “CPU Load”,
“tooltip”: {
“shared”: true,
“sort”: 0,
“value_type”: “individual”
},
“transparent”: true,
“type”: “graph”,
“xaxis”: {
“mode”: “time”,
“name”: null,
“show”: true,
“values”:
},
“yaxes”: [
{
“format”: “short”,
“label”: null,
“logBase”: 1,
“max”: null,
“min”: null,
“show”: true
},
{
“format”: “short”,
“label”: null,
“logBase”: 1,
“max”: null,
“min”: null,
“show”: false
}
]
}
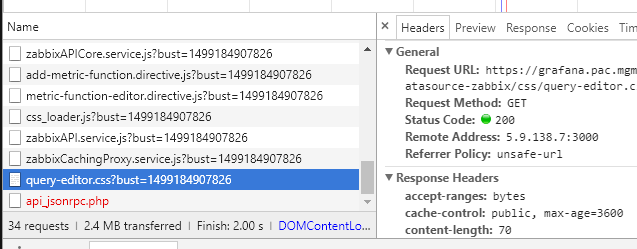
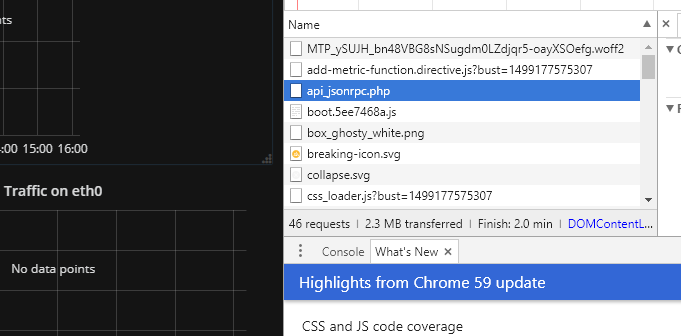
So, the api_jsonrpc.php is shown in red, thats all.