I’m very new at this, so please forgive me if I missed the answer to this question in the forums or am just don’t something dumb.
I have an issue where data series I graph have gaps.
I’m using a python collector script to push data to a graphiteDB instance. Looking at the actual graphiteDB data I see that the data points come in roughly every 65 seconds.

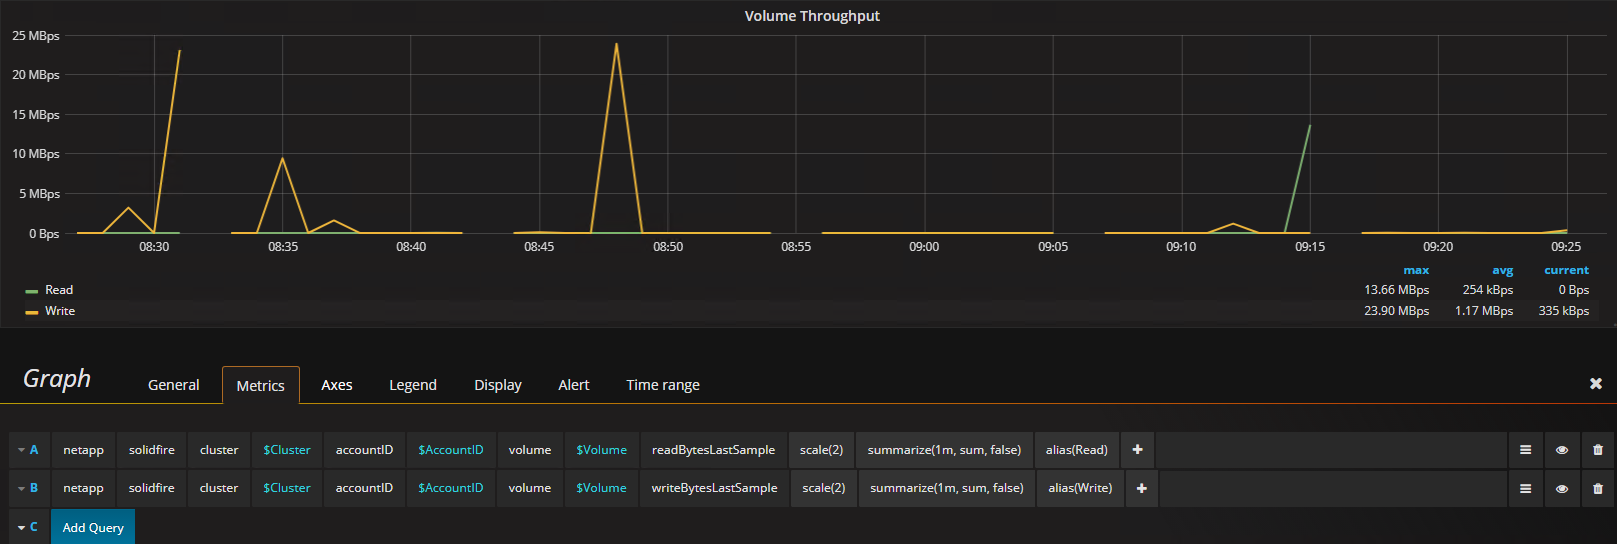
am using the summarize function after reading the following answer https://community.grafana.com/t/graphing-correct-network-values/734/5 I can make everything look good by setting “Null Value = Connected”, but that hides periods where the data source is actually down and I’d like to avoid that. I’d like to know if there is a way to “justify” the data to 1 minute intervals so I don’t end up with buck-tooth’d graphs.
Thanks in advance.