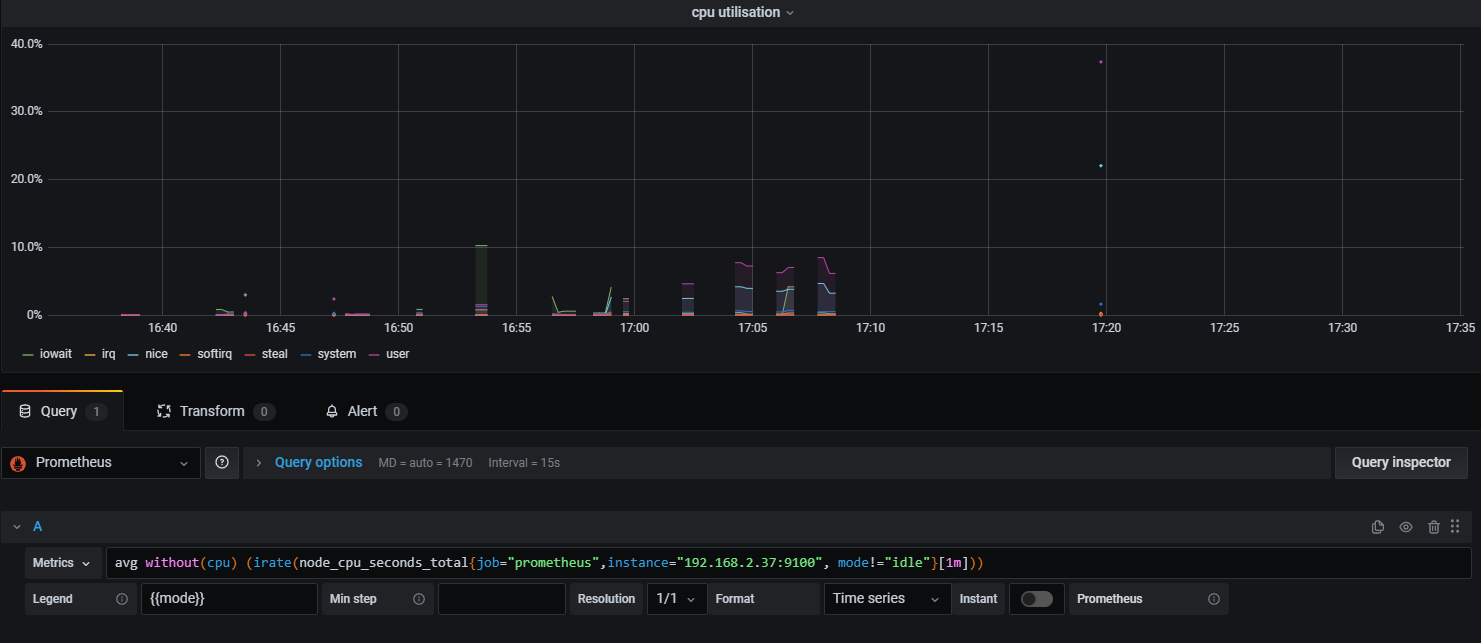
As you can see here between 16:23-16:38 and 17:13-17:20. All the services were running at that time, but there’s a gap. This is probably more a problem with node exporter or prometheus than with grafana but I thought is was still a good idea to ask here.
EDIT: I found a different graph that shows even less.
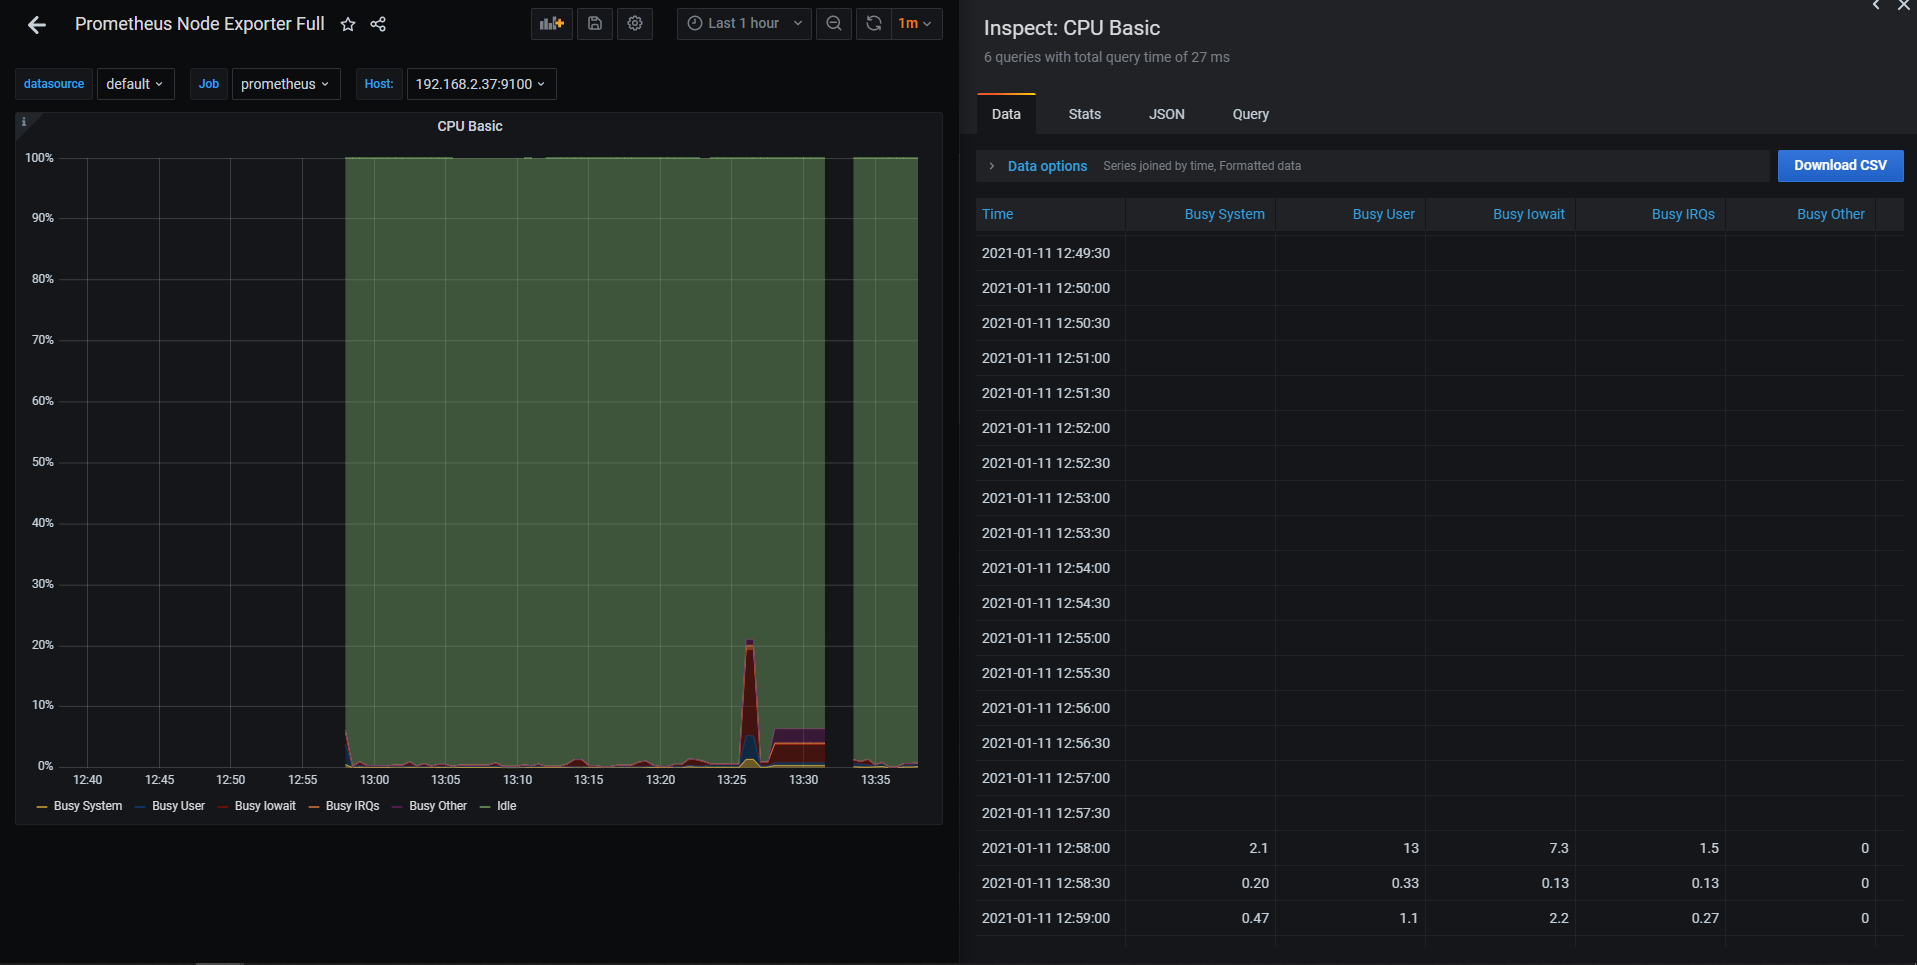
Hello @spamcassybren and welcome to the community! It would be helpful if you also shared the data or response from the query inspector, so we could see if there are actually any data. Because it seems that in your case, the data are not there.
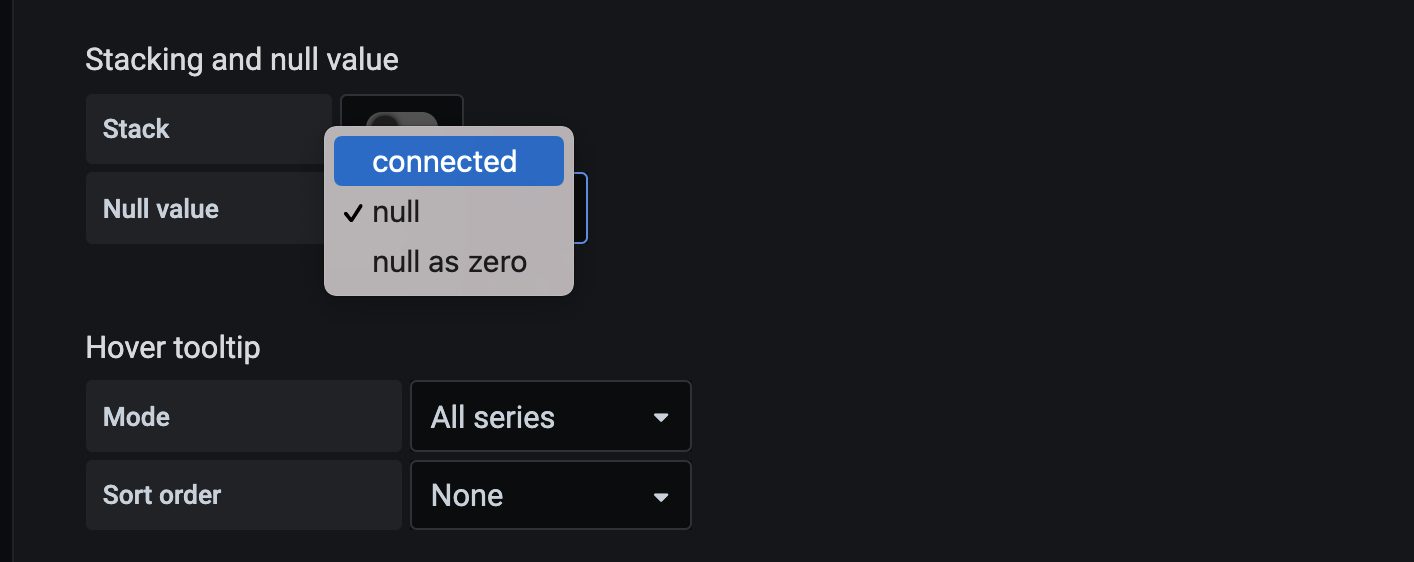
So the problem is that there are no values (result) for those time period covered by your query. If you would like to remove the gap in your graph on Grafana side, you can choose Connected null valuesPanel edit -> Panel -> Display -> Stacking and null value. “Connected” means that if you get a null value, join the preceding and succeeding values with a straight line, effectively pretending that you didn’t expect to get a measurement where the null appeared.
Strangely enough, the graph shows a line, but the inspector doesn’t show numbers…
Based on your screenshot, the inspector doesn’t show the numbers cause at that time (12:40 - 12:48), there are no data and they are not shown in graph either.