FYI: I come from the Splunk world with 10+ years of experience with all kinds of “interesting” query experience, so I hope and try to achieve some of the same tricks here in Grafana, and one comes here ![]()
-
What Grafana version and what operating system are you using? Latest
-
What are you trying to achieve?
-
- Basically I want to make a stats table, where I collect to see the following information in different steps:
-
- Just one row with the following information, and nothing else over picked time period:
-
1.1 Unique number of customers, unique number of hosts, unique number of monitored apps/systems/infrastructure, total events, total size of events, x columns representing different log levels (i.e. INFO, WARN, ERROR etc) in give time frame and per level total number of customers having this log level.
-
- On next level, I need a drill down on above, so if I click on the count of i.e. “ERROR”, then I’ll get a list showing all customers, one customer per row, with the following information:
-
2.1. Customer ID, Name, Number of hosts, Number of systems, per x log level, number of systems with current log level (not total number of i.e. errors, but how many system shows error)
-
- On next level in turn drill down to see an individual customers systems, one per row (as overall), and then further details below, that will work as drilldown depending on what is pointing at.
-
How are you trying to achieve it?
-
Simple query to stats count of log level by customer, host, system, and this part looks fine
-
What happened?
-
I get all log levels in one column.
-
What did you expect to happen?
-
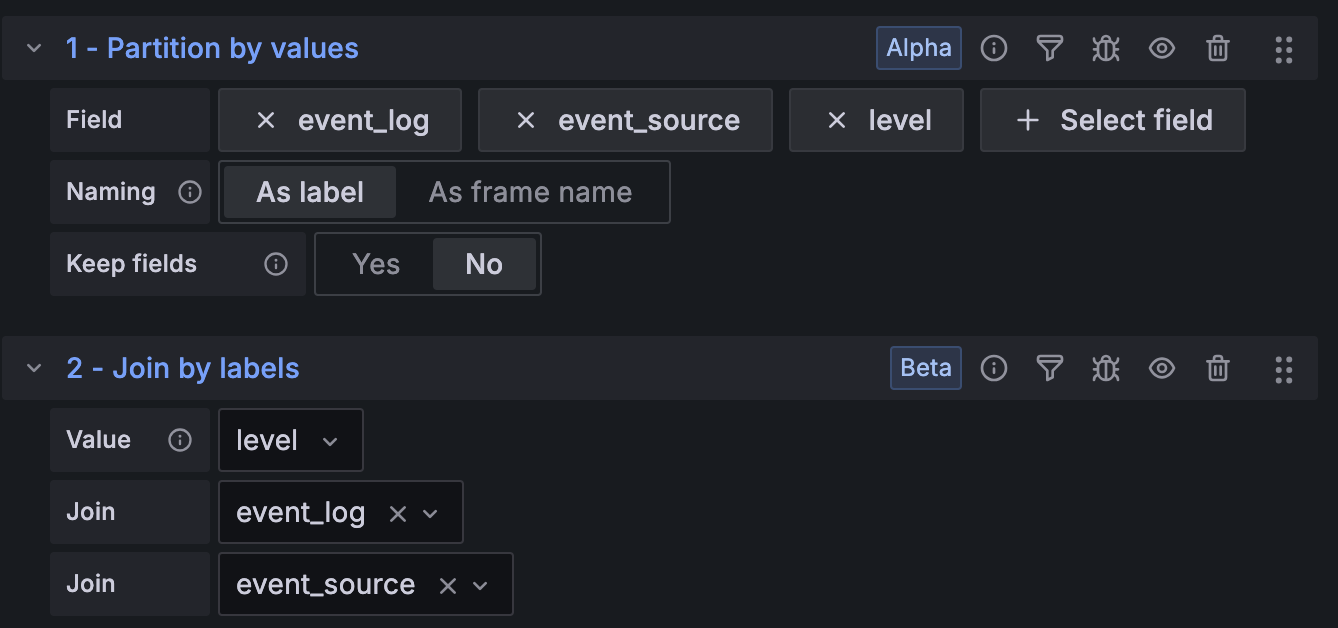
I need the log level (and only the log level) to be transposed to columns, which in Splunk is very easy (if you know how) by:
| fields level customer host system
| eval lev_[level]=1
| stats sum(lev_*) AS * BY customer, host, system
How can I achieve the same result in Grafana?
- Can you copy/paste the configuration(s) that you are having problems with?
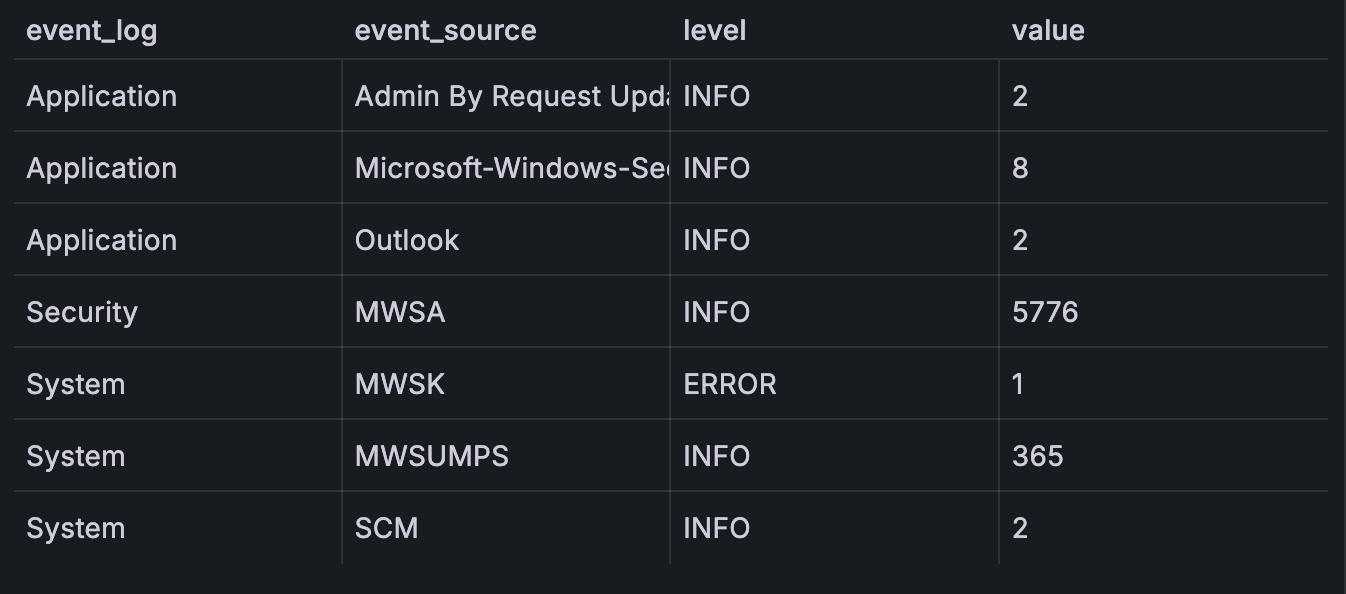
- As an example:

But should look like this:
| Time | event_log | event_source | INFO | ERROR |
|---|---|---|---|---|
| 2025-07-04 15:58:19.551 | Application | Admin By Request Updater | 2 | |
| 2025-07-04 15:58:19.551 | Application | Microsoft-Windows-Security-SPP | 8 | |
| 2025-07-04 15:58:19.551 | Application | Outlook | 2 | |
| 2025-07-04 15:58:19.551 | Security | Microsoft-Windows-Security-Auditing | 5776 | |
| 2025-07-04 15:58:19.551 | System | Microsoft-Windows-Security-Kerberos | 1 | |
| 2025-07-04 15:58:19.551 | System | Microsoft-Windows-UserModePowerService | 365 | |
| 2025-07-04 15:58:19.551 | System | Service Control Manager | 2 |
{
  "id": 5,
  "type": "table",
  "title": "Event Logs",
  "gridPos": {
    "x": 0,
    "y": 14,
    "h": 17,
    "w": 16
  },
  "fieldConfig": {
    "defaults": {
      "custom": {
        "align": "auto",
        "cellOptions": {
          "type": "auto"
        },
        "inspect": false
      },
      "mappings": [],
      "thresholds": {
        "mode": "absolute",
        "steps": [
          {
            "color": "green",
            "value": null
          },
          {
            "color": "red",
            "value": 80
          }
        ]
      },
      "color": {
        "mode": "thresholds"
      }
    },
    "overrides": []
  },
  "transformations": [
    {
      "id": "groupBy",
      "options": {
        "fields": {
          "Value #A": {
            "aggregations": [
              "sum"
            ],
            "operation": "aggregate"
          },
          "Value #Events BY level": {
            "aggregations": [
              "sum"
            ],
            "operation": "aggregate"
          },
          "Value #Size": {
            "aggregations": [
              "sum"
            ],
            "operation": "aggregate"
          },
          "Value #Total events BY level": {
            "aggregations": [
              "sum"
            ],
            "operation": "aggregate"
          },
          "Value #Total events BY level  2": {
            "aggregations": [
              "sum"
            ],
            "operation": "aggregate"
          },
          "customer": {
            "aggregations": [],
            "operation": "groupby"
          },
          "host": {
            "aggregations": [],
            "operation": "groupby"
          },
          "level": {
            "aggregations": [],
            "operation": "groupby"
          },
          "event_log": {
            "aggregations": [],
            "operation": "groupby"
          },
          "event_source": {
            "aggregations": [],
            "operation": "groupby"
          }
        }
      }
    }
  ],
  "pluginVersion": "12.1.0-90058",
  "targets": [
    {
      "datasource": {
        "type": "loki",
        "uid": "grafanacloud-logs"
      },
      "direction": "backward",
      "editorMode": "code",
      "expr": "sum(\r\n  count_over_time(\r\n    {customer=~\".+\",service_name=\"system/eventlog\"} \r\n      [$__auto]\r\n  )\r\n) by (level,event_log,event_source)",
      "hide": false,
      "queryType": "instant",
      "refId": "Total events BY level  2"
    },
    {
      "datasource": {
        "type": "loki",
        "uid": "grafanacloud-logs"
      },
      "direction": "backward",
      "editorMode": "code",
      "expr": "sum(\r\n    sum_over_time(\r\n        {customer=~\".+\"} \r\n        |= `` \r\n        | unwrap sizeB \r\n        [$__auto]\r\n    )\r\n) by (level,customer, host)",
      "hide": true,
      "queryType": "instant",
      "refId": "Size"
    }
  ],
  "datasource": {
    "type": "loki",
    "uid": "grafanacloud-logs"
  },
  "options": {
    "showHeader": true,
    "cellHeight": "sm",
    "footer": {
      "show": false,
      "reducer": [
        "sum"
      ],
      "countRows": false,
      "fields": ""
    }
  }
}
-
Did you receive any errors in the Grafana UI or in related logs? No If so, please tell us exactly what they were.
-
Did you follow any online instructions? Haven’t been able to find any If so, what is the URL?