Hello everybody,
this is my first post and i’m quite new to grafana.
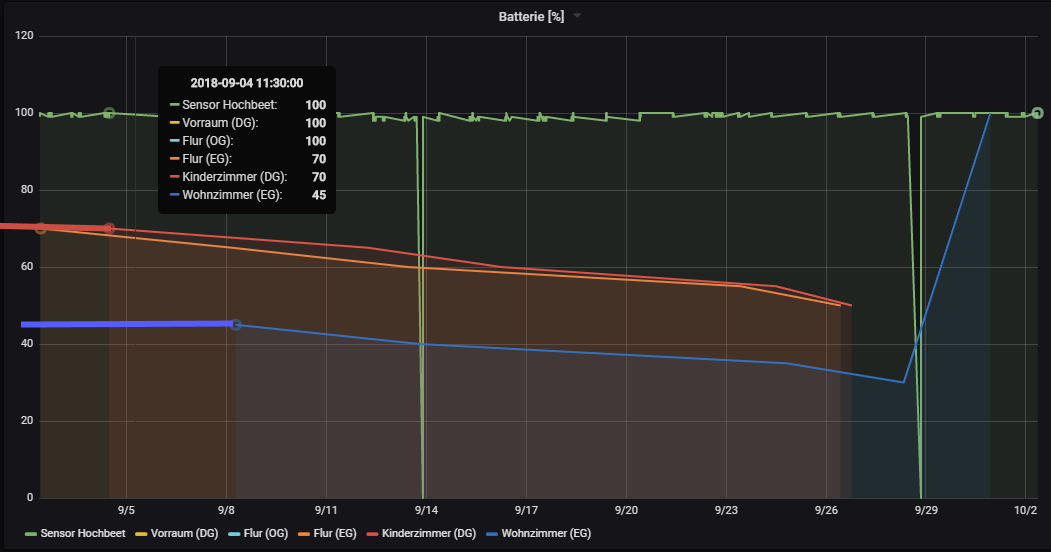
I have Grafana that access data from InfluxDB (Data are written by OpenHab). I have a dashboard that shows the battery capacity of some sensors within the last 24h (FTR: i’ve increased the time range in the screenshot to clarify my problem

Some of the sensors only report their battery state when the value has changed. So very often the last data point is outside of the selected time range. And therefore I have “ugly” gaps as you can see in the red/blue line series
Is there any possibility to tell Grafana to take data points outside the selected time range so that I get a series without gaps (like seen in the green one)?
I just want to tell grafana something like “if the last value is not at the beginning of the time range, draw a line from the previous data point and if there are newer and older datapoints but non of them within my selected time range, please also draw a line”
Maybe the following picture helps what i’ve tried to explain above:
Of course I could reduce the report interval of the sensors, but this would cause less battery lifetime.
I tried searching the forum a bit but couldn’t find anything. Maybe this also has to do something with InfluxDB. If I remember correctly i didn’t face this when using MySQL.
Any hints are appreciated.
Thank you
