A line chart displaying a single line for each variable, chosen by a filter selection
I have a line chart displaying the battery voltage of a large number of AGV’s over a selectable time period, with filters to select the AGV system and number. The data table shows the time stamp in column 1, the AGV number in column 2 and the voltage in column 3.
When the data is displayed as a chart, the time filter function correctly, but all the AGV values are combined into a single line. as I filter the selection, to an individual AGV, the data is correct, but as a group, the combined data is not relevant.
A single chart showing multiple lines per AGV, displaying the voltage over time
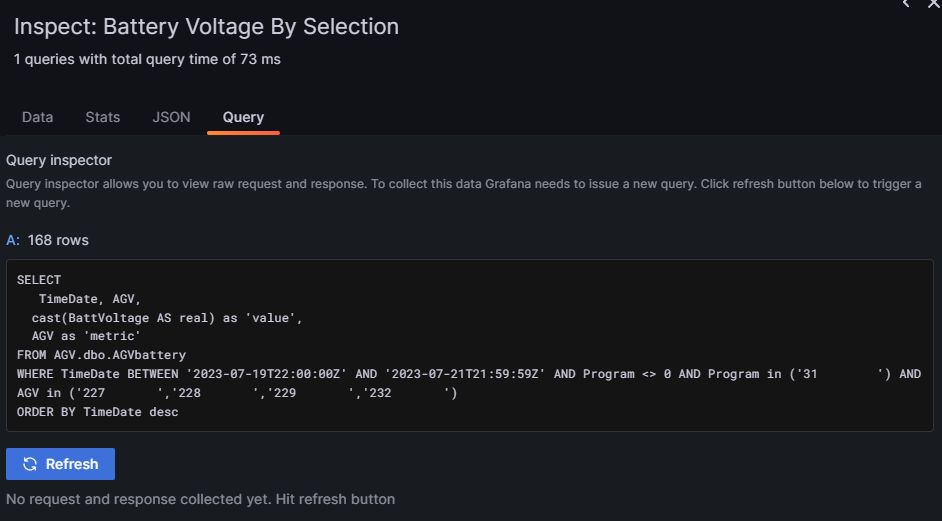
SELECT
TimeDate, AGV,
cast(BattVoltage AS real) as ‘value’,
AGV as ‘metric’
FROM AGV.dbo.AGVbattery
WHERE $__timeFilter(TimeDate) AND Program <> 0 AND Program in ($Program) AND AGV in ($AGV)
ORDER BY TimeDate desc
No errors shown, just not the correct visualisation for the data
the first image is the current chart, with dynamic selection, but showing the the four selection as one data line. the second image is a chart driven off four fixed value queries but shows how i would like to see the data.
Hi, please see image for inspection. the data all looks correct, it just seems to plot all the data as one series, instead of a single instance per result.
I did , but could not get it to work as intended, I guess due to an error with my initial query table. I have got it working now, displaying exactly the information I would like to see. Thank you.
Is it possible for the chart filter at the base of the chart to be customised? although the data is now correct, it says Voltage (number of AGV) which looks confusing to the end user.
I have tried to use the override function, but this replaces the variable with a fixed value, for example it previously said Voltage 123, Voltage 456, Voltage 789 etc… and with override it now says AGV, AGV, AGV, etc…
I am trying to get the combination.
AGV 123, AGV 456, AGV 789 etc…
SELECT TimeDate as time,
    AGV as metric,
cast(BattVoltage AS real) as value

FROM AGV.dbo.AGVbattery

WHERE $__timeFilter(TimeDate)
AND Program <> 0
AND Program in ($Program) AND AGV in ($AGV)

ORDER BY TimeDate desc
whereas you are doing
AGV as 'AGV', cast(BattVoltage AS real) as 'Voltage'
This has already been answered not sure what the new issue is?