I would like to create a time-series graph that displays 2 sets of data on the same graph:
The query is a prometheus query that looks like:
A:
queued{user=""}
B:
reserved{user=""}
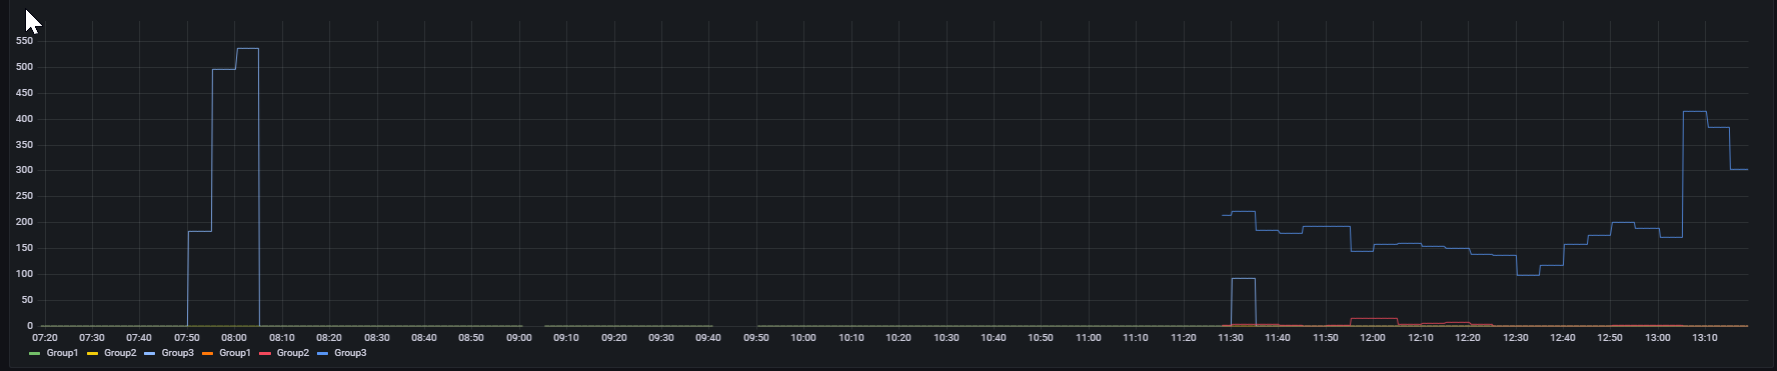
When I select a group, I get a pair of values displayed:

This is exactly the behavior I want (a single click filters out everything but a pair of values).
But what I am missing is a way to distinguish between them. i.e. I want the tooltip to display “Group3-reserved” and “Group3-queued” and I just want a single “Group3” displayed in the legend (I don’t want “Group3-reserved” and “Group3-queued” independently selectable).
Is there any way to achieve this?
I realize that I could use a multi-select variable but that will filter the entire dashboard, and I want to apply the filtering only to a single chart