Hi,
I am quite new to Grafana and am now using version v10.4.0. This version seems to be different from the version 9.4.3 I have been using so far in terms of Time series formatting.
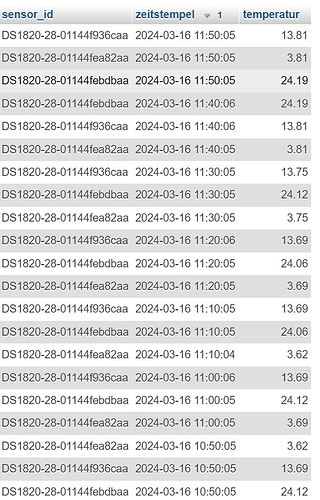
I have a table in a MariaDB with the following structure:
and the following data
I would like to display the temperature curves in a graph. Each temperature sensor should have its own line.
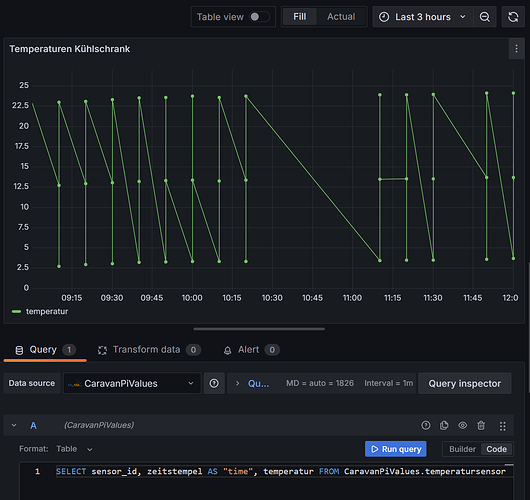
This is what I have tried so far:
SELECT
sensor_id,
zeitstempel AS “time”,
temperatur
FROM
CaravanPiValues.temperatursensor
But then I get a graph with one line
Such queries worked in version 9.4.3 for me
What else do I need to set or configure so that the data is displayed in different lines?
Thank you very much for any help
Regards
Sepp


