@sowdenraymond: Thanks, but unfortunately this does not work.
On the x-axis I still have 2024-01, 2024-02, 2024-03, etc.
It seems it has only effect on the tooltip:
@sowdenraymond, Thanks again, but changing the settings in grafana.ini makes this a general rule tha applies to all time series panels.
If I set this to e.g. MMM in every time series panel I get (just) the short monthname.
But may in other time series panels I want to get YYYY-MM, etc.
I wish to have an option to select one column für ‘time’ and another one for the display value.
Or any other hack?
I am trying to achieve the same thing, getting only the month displayed on the x-axis of a Time series panel.
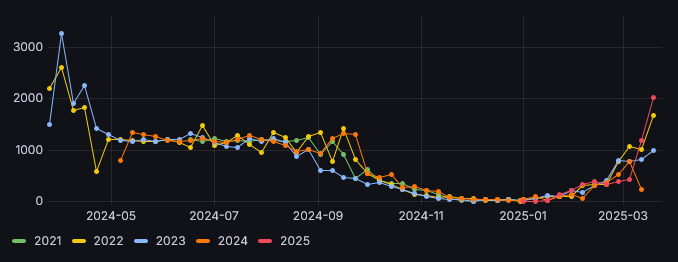
The reason I want to do this is that I am having time series plot comparing values for different years. I am having the data stored in a postgresql database and I am doing some SQL to move all older data to the same day of year in the current year and having the original year as a parameter. (And before somebody tells me about leap years. I am perfectly aware of that, using day of year rather than date, each fourth year gets doy 366, that is not a problem in what I want to do)
For example, a plot of daily production from a solar panel for the years 2021-2025:
It is readable, but would be better if it was labeled with just the month and not the year as well.
By all means, if I have overlooked something and there is another way of getting a similiar plot with “folding” all the years into the current, I could use that. I could of course query postgres to get the columns year, day of year, value and plot day of year vs value in a XY diagram, but then the X-axis label would be day of year (i.e. 1-365/366) which would be pretty difficult to interpret.