Hi Team,
Grafana version: 9.5.1
Problem statement:
https://grafana-dashboard.uat.robinson.systems:3001/api/datasources/proxy/uid/hTM8z3J0JW-WiHGaRovd3-nui1BJYWth-mjoPvipMkt-yEepxtR6iF/query?db=inventory_management&q=*SHOW%20RETENTION%20POLICIES*%20on%20%22inventory_management%22&epoch=ms
The InfluxQL query being made is:SHOW RETENTION POLICIES on “inventory_management”
The above query is not written anywhere within the panel and I don’t understand what’s causing the creation of this query.
What I expect to happen:
I expect this request not to be made in the first place.
Online clues found:
Tried finding some clues from here:
opened 02:42AM - 02 May 23 UTC
closed 01:01PM - 03 May 23 UTC
datasource/InfluxDB
###
# What went wrong?
**What happened**:
- Upgraded to Grafana 9.5.1 … from 9.4.x.
- Have InfluxDB plugin configured to use Flux queries
- Lots of error logs that look like this begin to appear:
```
logger=tsdb.influx_flux t=2023-05-02T02:34:47.392159245Z level=warn msg="Flux query failed" err="invalid: error @1:1-1:5: undefined identifier SHOW\n\nerror @1:6-1:15: undefined identifier RETENTION\n\nerror @1:16-1:24: undefined identifier POLICIES\n\nerror @1:25-1:27: undefined identifier on" query="SHOW RETENTION POLICIES on \"undefined\""
```
- There doesn't seem to be any visible issues when actually using Grafana
**What did you expect to happen**:
- No repeated constant errors.
###
# How do we reproduce it?
I'm not 100% sure how to reproduce this but I believe the issue is that [this change](https://github.com/grafana/grafana/pull/66466) is applying to datasources using Flux on InfluxDB 2.x when it should only apply to InfluxQL on 1.x. If that's the case, the following steps should work:
**Step 1**: Setup an InfluxDB 2.x instance. I'm currently using 2.7.0.
**Step 2**: Setup Influx DB datasource using Flux as the query language.
**Step 3**: Setup some dashboards from data in the datasource.
**Step 4**: Observe errors in the log about retention policies.
###
# What Grafana version are you using?
v9.5.1
###
## Optional Questions:
### Is the bug inside a Dashboard Panel?
No, unless being in a query that a dashboard panel uses counts.
### Grafana Platform?
Kubernetes
### User's OS?
Ubuntu 22.04
### User's Browser?
Chrome Version 112.0.5615.165 (Official Build) (64-bit)
### Is this a Regression?
Yes
### Are Datasources involved?
InfluxDB 5.0.0
### Anything else to add?
_No response_
But this seems to refer to this queries being redundantly made when using Flux.
Could you please advise on the above?
cc: @melori.arellano and @mattabrams tagging for attention please
I would say that is a feature of query editor
It will discover retention policies and then you can select exact retention policy names instead of guessing those names.
Hey Jan, I couldn’t find any reference to retention policy in the link you shared, could you please point me to the relevant section?
Also, do you think we can configure any settings such that this retention policy query is not made?
See:
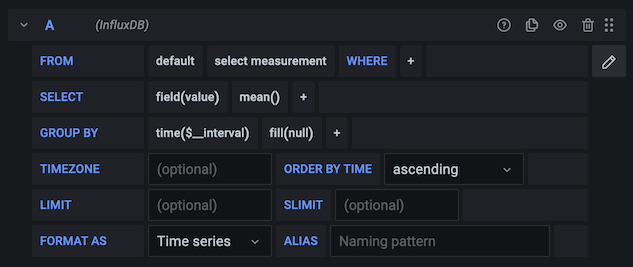
That default in FROM section is retention policy. I bet UI will offer you all available retention policies when you click on “default”. And that retention policies list must be discovered somehow first - that’s via that query which you are referring.
But my query is edited and is as follows:
I don’t have default as part of the from statement, am I missing something here?
Yes, but that doesn’t mean that UI may not prepare data for the case when you switch to query editor instead of raw query editor.
@jangaraj Any reason why it doesn’t mean that the UI may not prepare the data for the case when I’ve switched to query editor?
Nowhere in the query editor is a query relating to retention policies so any idea on what basis the UI is persisting on making the retention policy query and how to stop it?
cc: @melori.arellano and @mattabrams tagging in case you have some ideas too please
You have very specific case, so I recommend to check source code to know more.
Anyway, is it causing you any trouble that Grafana executes this query?
Hi @ajetsharwin It is happening because of this lines https://github.com/grafana/grafana/blob/v9.5.x/public/app/plugins/datasource/influxdb/datasource.ts#L193-L214
Basically, for that version, I changed the code to load the retention policies in the beginning so I can show the “default” retention policy on the panel if there is none selected. Then I changed that behavior again. Not because it was wrong but I need to support the new influxdb engine. See here: InfluxDB: Fix retention policy handling for InfluxDB 3.0 engine by bringing back the hardcoded default by itsmylife · Pull Request #72467 · grafana/grafana · GitHub
So there is nothing wrong with having that query being made.
2 Likes