Try to setup grafana to use an external prometheus source.
Curl show the result page when i try to connect from the same system.
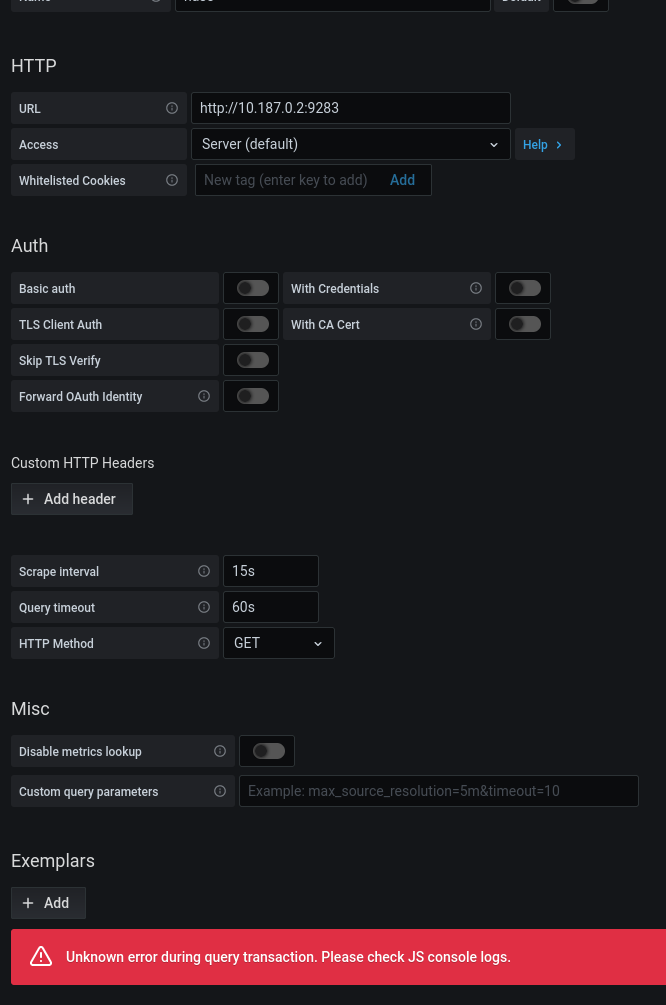
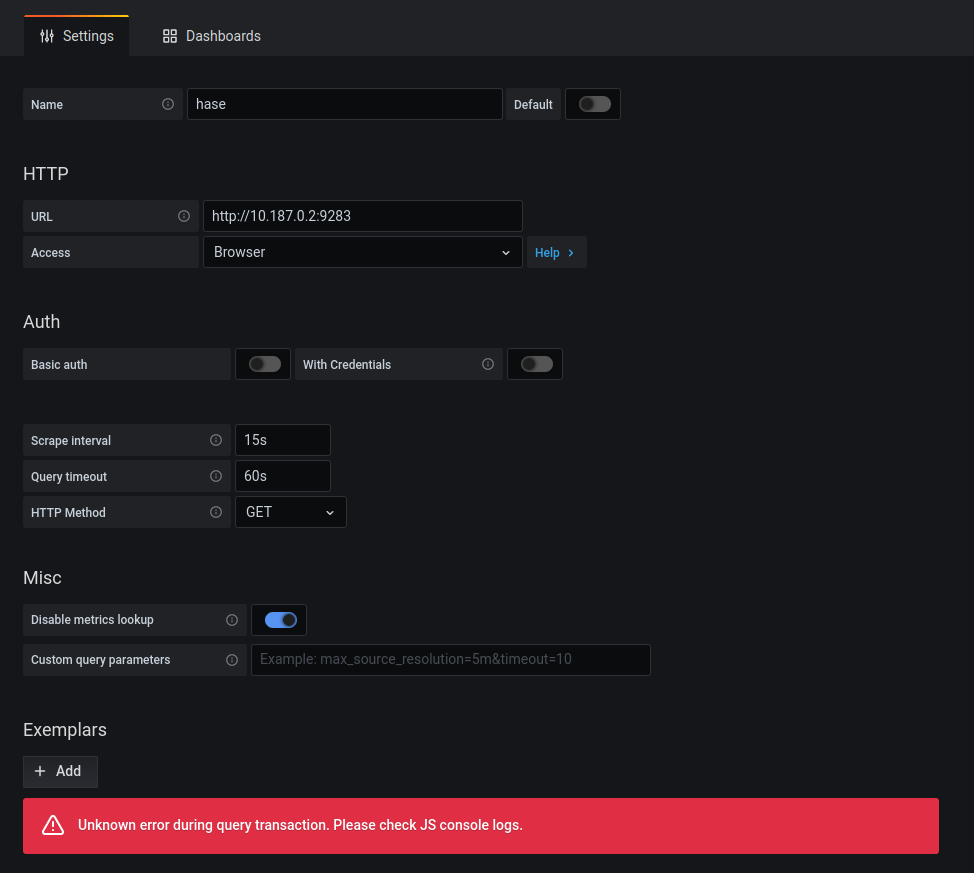
After adding source and select Browser Grafana is doing 0 network traffic to this source.
Using version 7.5.10
From doku here:
Cant see my mistake.