Hello,
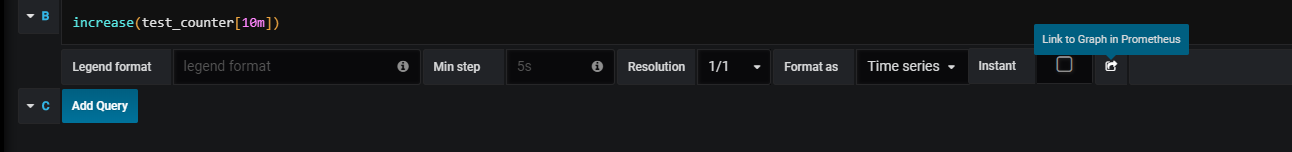
I am using Prometheus as a datasource in a deployment where Prometheus is accessible to the Grafana backend, but not to users of Grafana. In this setup I end up with ‘broken’ links to the Prometheus web GUI in my dashboards (e.g. when adding metric queries for a new panel (see image)). Preferably these links would not exist in this deployment.
Is this a deployment model that is unsupported? Are there other bits of function that may go wrong with this setup that I should know of?
Thank you for your time.