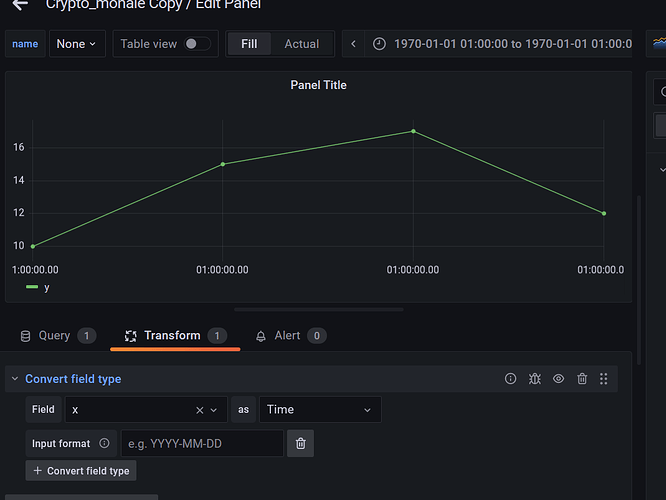
Is it possible to have a line chart with two variables on the X and Y axes with no Timeseries data?
Could you please provide sample data. basically if your data does not have time value you cannot plot it on a time series…for obvious reasons ![]()
Haha. Yes .I agree. But sometimes there is a need to see or show how two variables react or playout and a line chart is very helpful at that time.
Below is the data I am trying to plot, using a plugin called Plotly Panel
X-Axis: 1,2,3,5
Y-Axis: 10,15,13,17
And below is the result.
The X-axis data is converted into a random Date or Timeseries.
Hope this helps.
Thanks.
What is the data source you want to plot?
Right now, working with a csv file as the data source.
hello,
you can do it with a classic time series
if you convert x in time type
but you need to select the time range.
Since it’s default date is old this is not really convinient if you want use your time range for other panel on the board.
you can use bart chart by converting x in string but obviously it’s not a line…
Maybe the best option now is to use apache echart panel:
it’s not using timerange and you have lot of option avaible to customise it.
Thank you Alex.
Yes. I am able to use Bar Chart as the workaround for not having a line chart. But the requirement is to do a line chart with the details on X Axis as it is.
and the other option ?
don’t you like apache echart result?
here is all avaible chart with this panel, starting with line :
Thanks Alex. Your solution works.
Is there any chance to completely remove the time element from the X Axis? Also change the legend, here it shows Downloads, maybe from the folder.
Of course there is more option we can imagine,
Hide x axis legend should be doable.
xAxis: {
show: false },
add this in your option
please take time to read/watch the grafana plugin page
and you can use documentation like me
Great. Thanks so much Alex. Will go through the documentation and see how to incorporate Zoom and other things.
I needed to create a dashboard along the same lines, with quarters on the x-axis.
I came up with this example, with an XY Chart view, placing the quarter numbers on the x-axis.
I added a value mapping for the decimals between the whole numbers of the Quarters, so that a hyphen appears in place of these decimals…
Even though this is an old question, I hope it helps!


