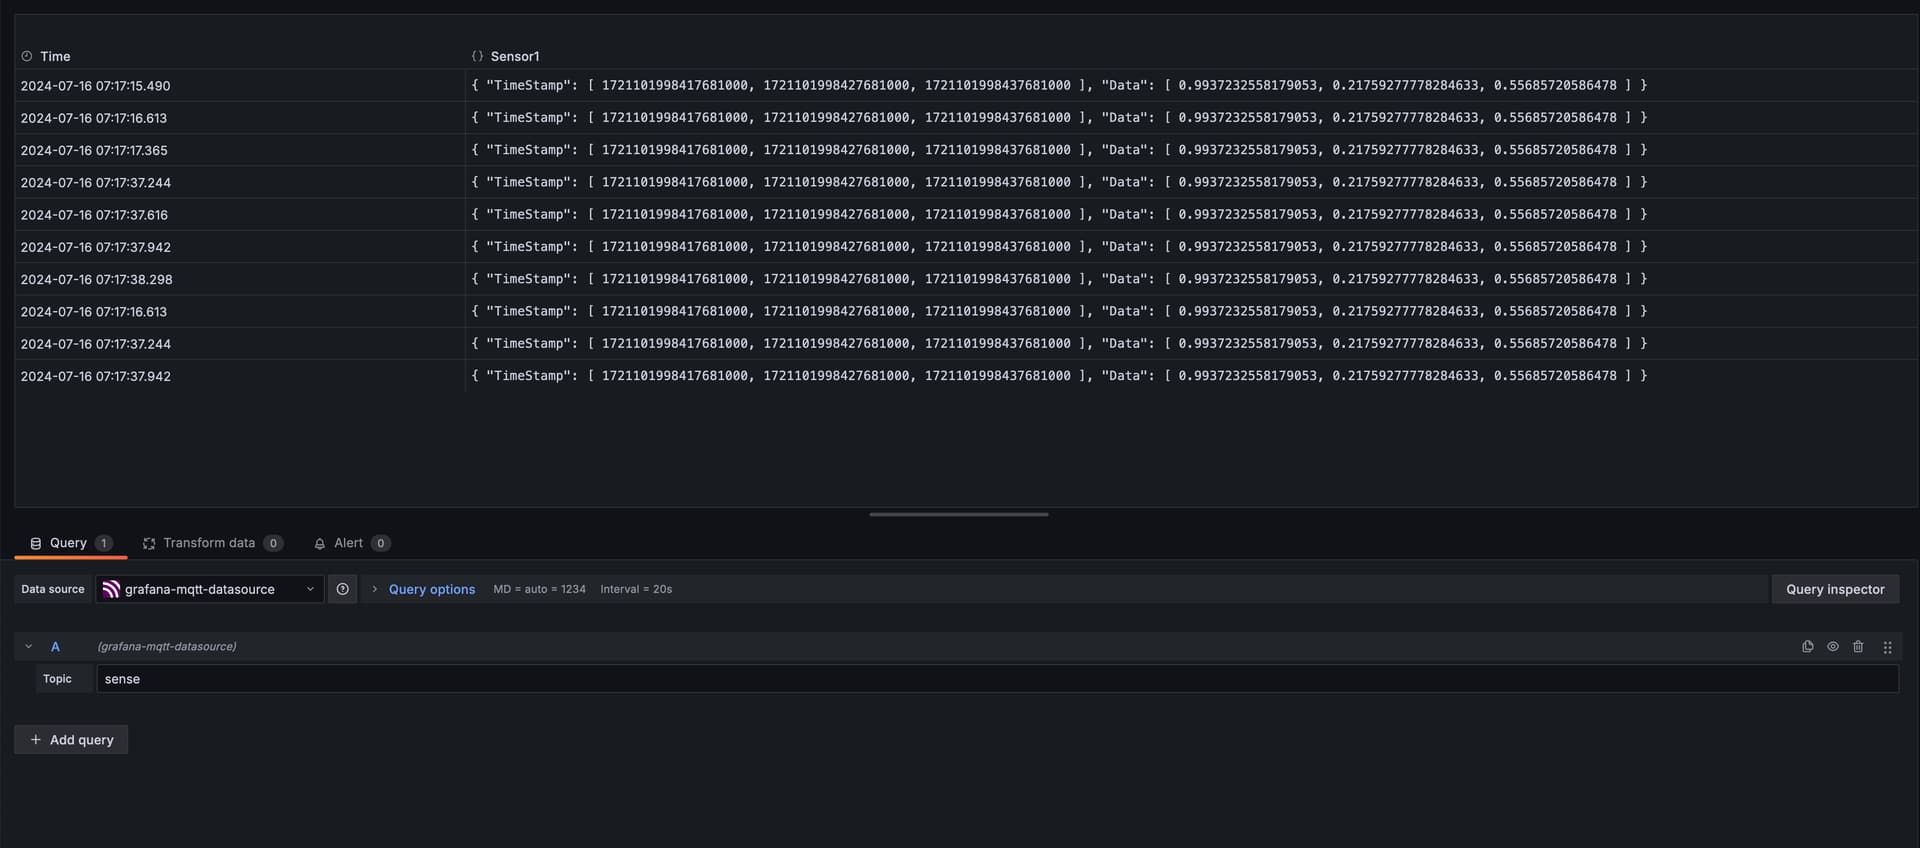
I appreciate the help ebabeshko. I am using mqtt as the data source. I have attached a photo of the setup with table view so you can see the data come in.
If a do a transform of extract field (replace fields) i get the following:

I could do another individual extraction on time and data and I can plot 1 point (t1,data1)
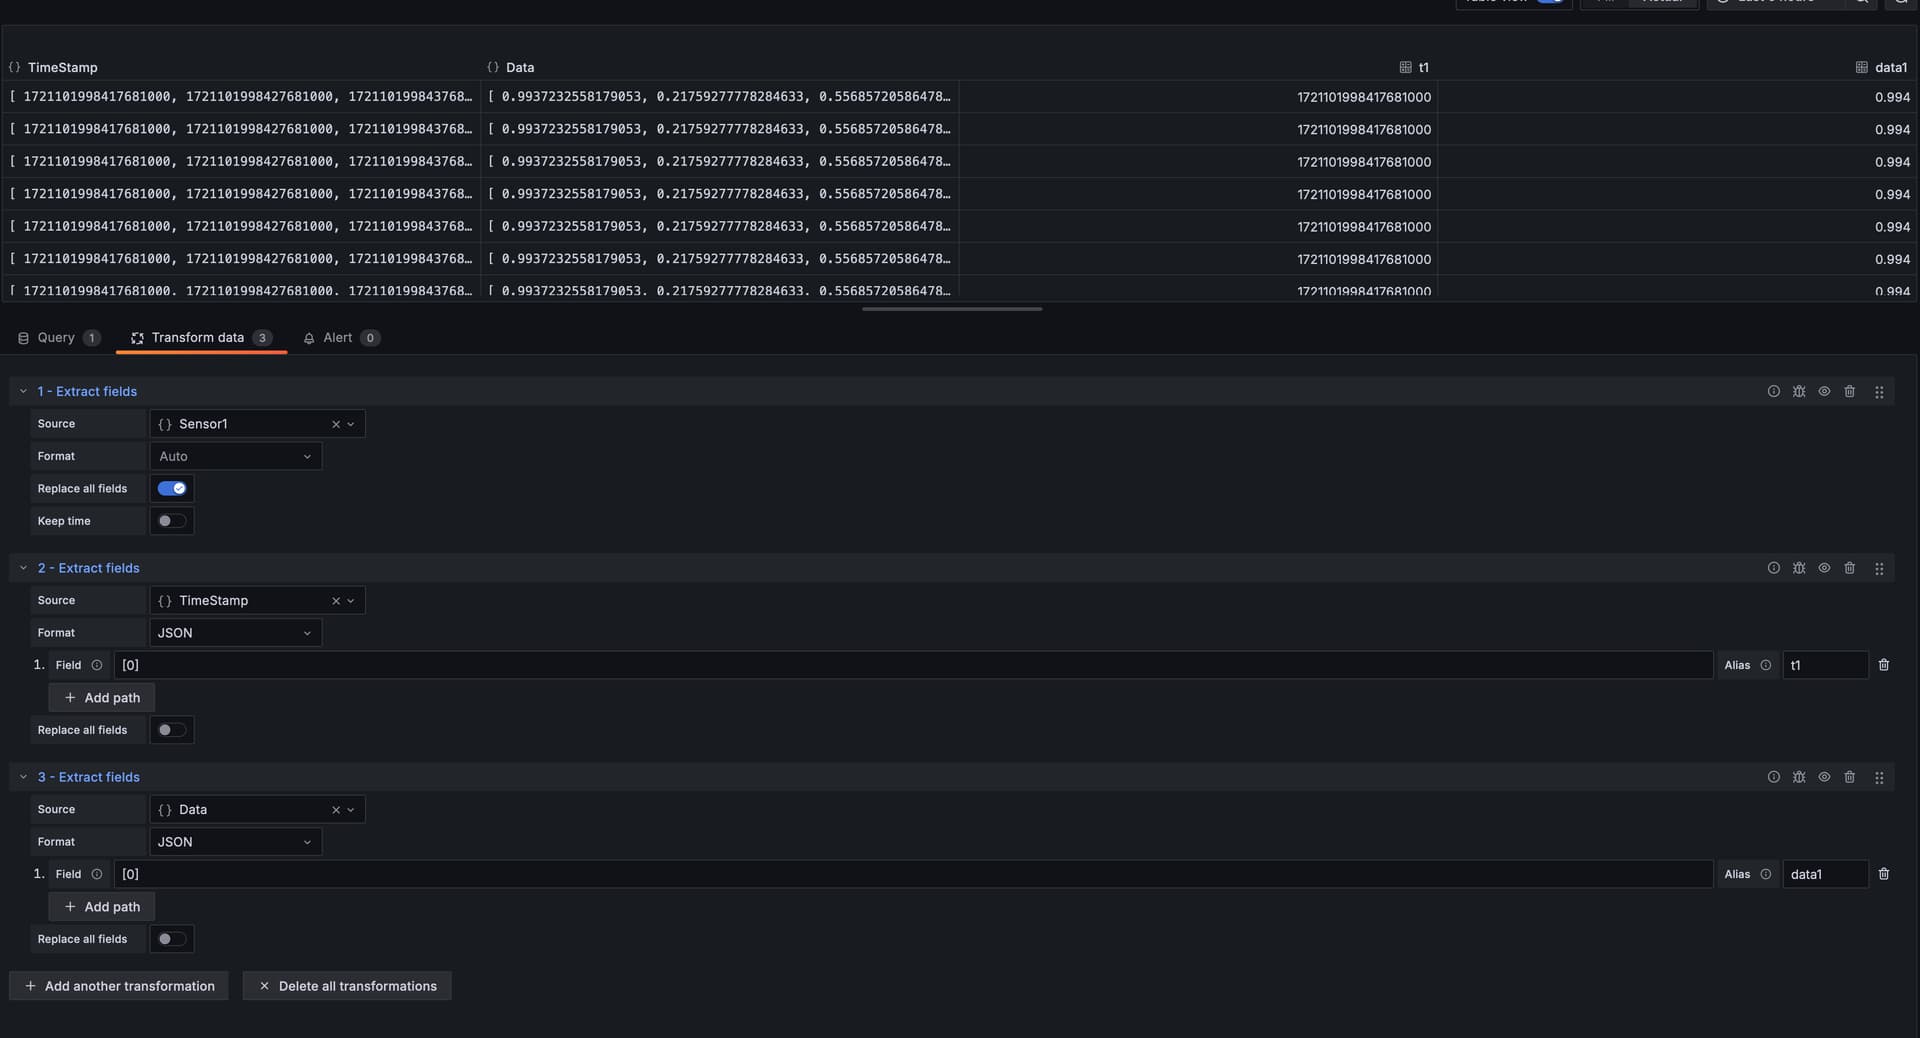
however i can’t figure out how to plot the 3 sets of points as one data set. Any advice would greatly be appreciated.