Hello I got a problem with Grafana and after an hour of debug, changing version, trying to reimport dashboard I can’t figure it out. Please help me ![]()
- What Grafana version and what operating system are you using?
Version 12.0.2 (dockerized)
- What are you trying to achieve?
Import dashboards from API
- How are you trying to achieve it?
I got a Python code that generate grafana dashboard as json from presets.
Then I use the grafana API
- What happened?
After using the API calls even if I got 200 anwsers it appeared that some parts of the panels become invisible. To be sure it is not my dashboard that is bugged I check this one that is imported from grafana.com : Node Exporter Full | Grafana Labs

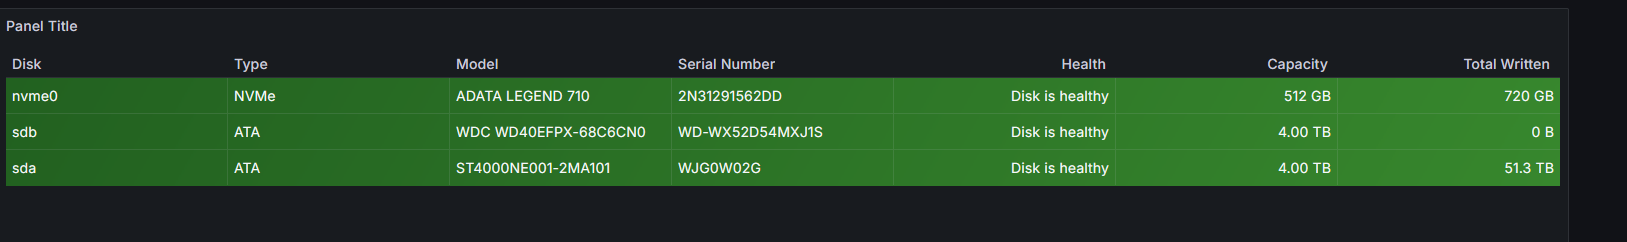
The thing that is weird is that some panels are still working like this one
- What did you expect to happen?
I expected the dashboard to be displayed properly
- Can you copy/paste the configuration(s) that you are having problems with?
Here is my dockerfile to launch the service. It worked
for a while since I tested my code to generate a json that I imported manually via the front.
grafana:
    user: "${USER_UID}:${USER_GID}"
    container_name: grafana
    image: grafana/grafana:12.0.2
    networks:
      - monitoring
      - proxy
      - authelia
    volumes:
      - /srv/grafana/data:/var/lib/grafana
    environment:
      - GF_SECURITY_ADMIN_USER=$GRAFANA_USER
      - GF_SECURITY_ADMIN_PASSWORD=$GRAFANA_PASSWORD
      - GF_SERVER_ROOT_URL=https://grafana.domain.com
      - GF_SECURITY_ALLOW_EMBEDDING=true
    ports:
      - 3000:3000
    labels:
      - "traefik.enable=true"
      - "traefik.http.routers.grafana.rule=Host(`grafana.domain.com`)"
      - "traefik.http.routers.grafana.entrypoints=websecure"
      - "traefik.http.routers.grafana.tls=true"
      - "traefik.http.routers.grafana.tls.certresolver=myresolver"
      - "traefik.http.services.grafana.loadbalancer.server.port=3000"
      - "traefik.http.routers.grafana.middlewares=authelia@docker"
- Did you receive any errors in the Grafana UI or in related logs? If so, please tell us exactly what they were.
I recieved no sign of any error.
- Did you follow any online instructions? If so, what is the URL?
I used the grafana swagger presented by my grafana instance.