last 7 days - max value around 1.5k

last 90 days - same max value for July 7th looks like around 2k

The metric is a 15min sum metric from cloudwatch data source
Is there some way to change this behaviour? What am i missing here 
The further out i go e.g. last 90days, the larger the value i get. Is Grafana doing somesort of aggregation, ideally i want to see the same max values regardless of zoom/time scale.
Can you show your query? I’m not a cloudwatch expert but with other data sources then this could happen when looking at data with different retentions.
The retention for Cloudwatch is:
- Data points with a period of 60 seconds (1 minute) are available for 15 days
- Data points with a period of 300 seconds (5 minute) are available for 63 days
- Data points with a period of 3600 seconds (1 hour) are available for 455 days (15 months)
So the data is grouped by 1 hour periods after 63 days which makes the spikes bigger and when you zoom in then they are grouped by smaller periods.
Maybe someone who knows more about Cloudwatch can chime in about how to smooth that out? For example Graphite has a summarize function for this.
That would explain it… but the spike in this case is from a few days ago so i dont think that’s relevant in this case.
Also the data is displayed consistently in my cloudwatch dashboard (same peak value @ same time) regardless of the zoom (eg last 7 days, last 30 days, last 90 days).
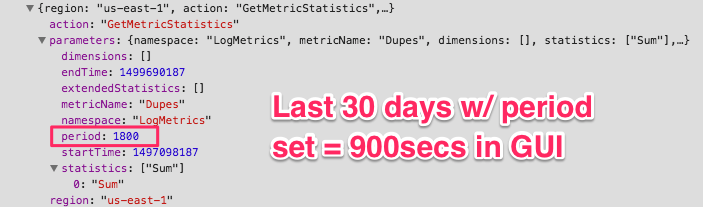
Here are the actual queries sent, looks like grafana is changing the “period/timerange value”, even though i have not changed it in the GUI.
Yes, that is the auto behavior for the period. When there are more points than pixels then it optimizes by grouping by a larger period (as there is no point in sending more data points than the graph can show - they would have to be aggregated: summed or averaged). There is a period field in the Cloudwatch data source. But it works differently to other data sources so I’d have to check the code (not a Cloudwatch expert). I think it works by setting the minimum period so it wouldn’t help when zooming out a lot.
That’s why I wondered:
ok thanks for your help. Once we can understand the behaviour that’s fine.
I suspected this is what was happening thanks for suggesting to check the actual query.
Colm