Organize fields transformation resets after changing variables

Hi Experts,

I am using InfluxDB 2.1.1, and Grafana v8.3.2 (afb9e8e5f). The connection is set up with Flux. I want to display basic system logs from a bucket.
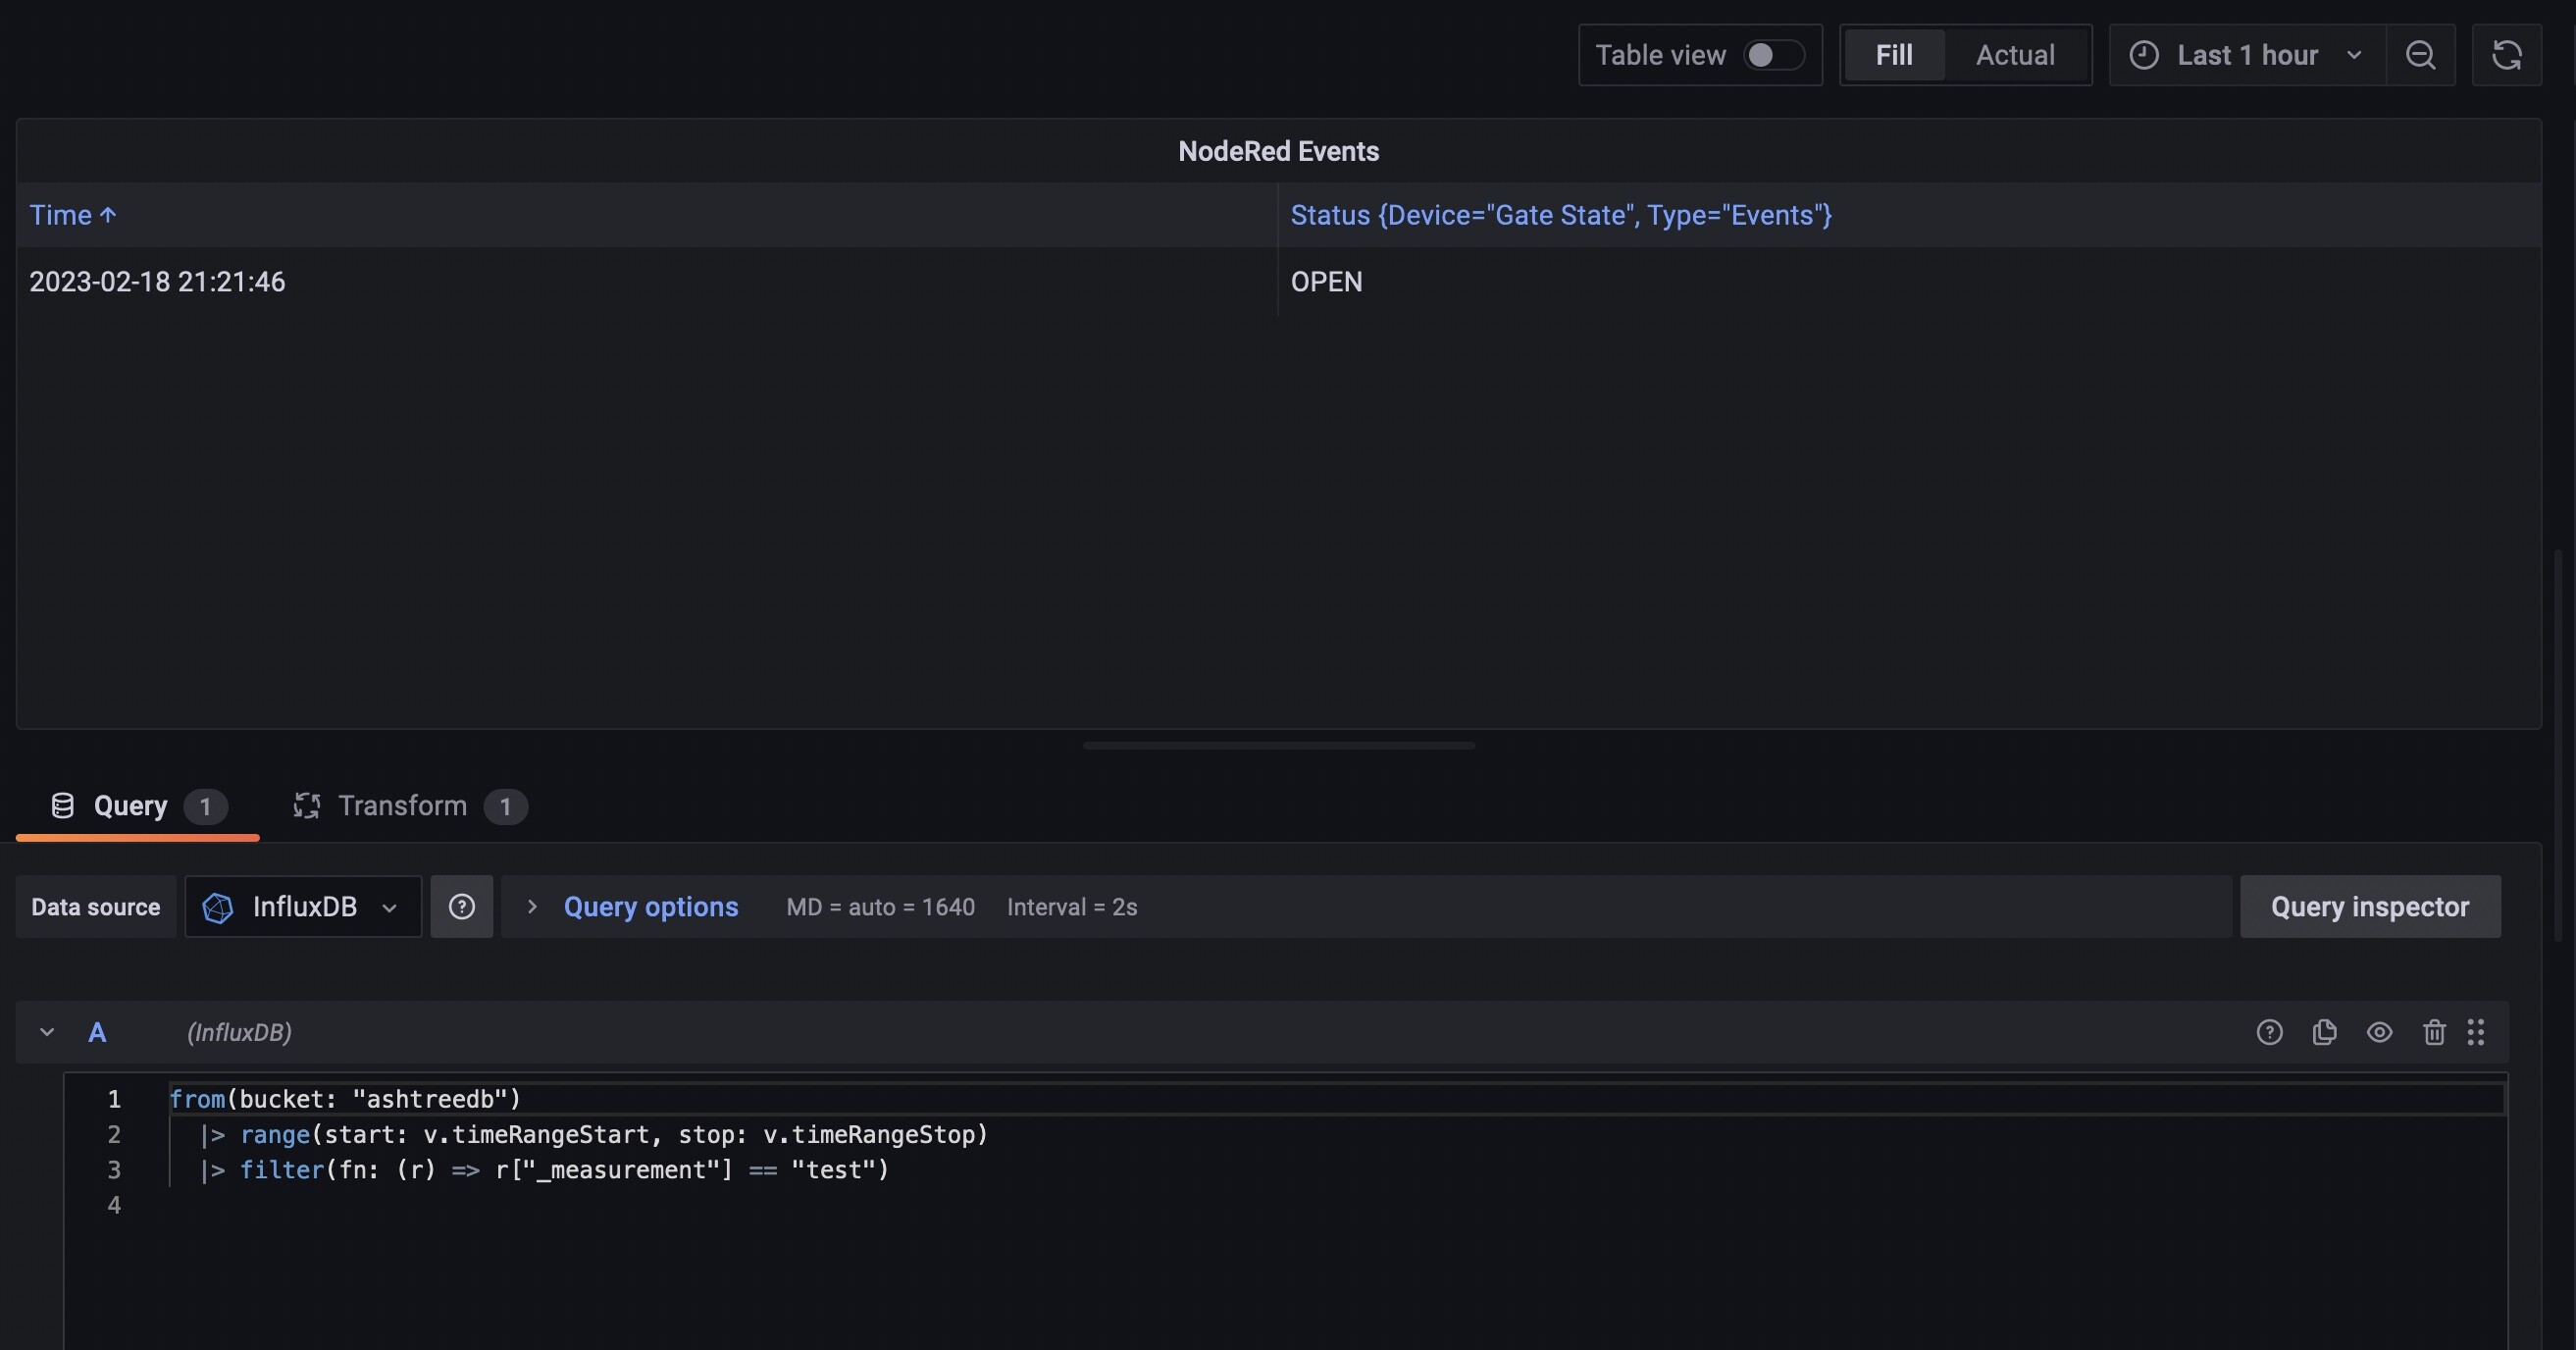
I have a few variables set on the dashboard and the query for the a table view is set up like this:

from(bucket: "log")
  |> range(start: v.timeRangeStart, stop: v.timeRangeStop)
  |> filter(fn: (r) => r["_measurement"] == "accesslog")
  |> filter(fn: (r) => r["result"] =~ /^${result:regex}$/)
  |> filter(fn: (r) => r["name"] =~ /^${name:regex}$/)
  |> filter(fn: (r) => r["type"] =~ /^${type:regex}$/)
  |> group(columns: ["_measurement"])  
  |> drop(columns: ["_field"])
  |> sort(columns: ["_time"], desc: true) 

I use “Organize fields” transformation to rearrange and rename the fields. And everything is working just fine as expected:

But if I make any change to the variables, the table updates, but the columns reset:

I am guessing the query contains less tables in the response hence the view thinks this is a different structure and the field settings no longer apply. But in my case it is always the same. I even added a Merge hoping that it will “flatten” the tables, but it does not help.

Is it possible to “fix” the transform not allow it to be changed? Or any other way to archive the same result?

Regards,
Csongor

I realized, I should have used the Overrides and not the Organize Fields transformation. But correct me if I am wrong.

But it looks like the Overrides still ignores me the order I maintain the fields. And if I only use Organize Fields to set the column order, that still resets after each time range change.

I have hit the same roadblock. I know Grafana is open source but fixing this issue is way beyond my skill level.

Would be great if someone could look at this?

Thank you
Ian

Ian

How about usong rename function of flux instead

Thank you. I tried that but the column name to be changed (e.g.) Device {_start="2023-02-18 06: etc etc etc } is diferent every time the data is pulled (diferent time stamps). So I am not sure how I can identify the column to be changed to “Device”.

Ian

hmmmmm, I have looked at this again…

so maybe if my column name is Device {_start="2023-02-18 06: etc etc etc } , I just need a regex expression to find “Device {_start” (i.e. new regex expression - below) and change “${column} (Reserved)” to “${column} (Device)” ?

|> rename(
     fn: (column) => {
         _newColumnName = if column =~ /new regex expression/ then "${column} (Device)" else column

         return _newColumnName
     },

Hi @ianhud,
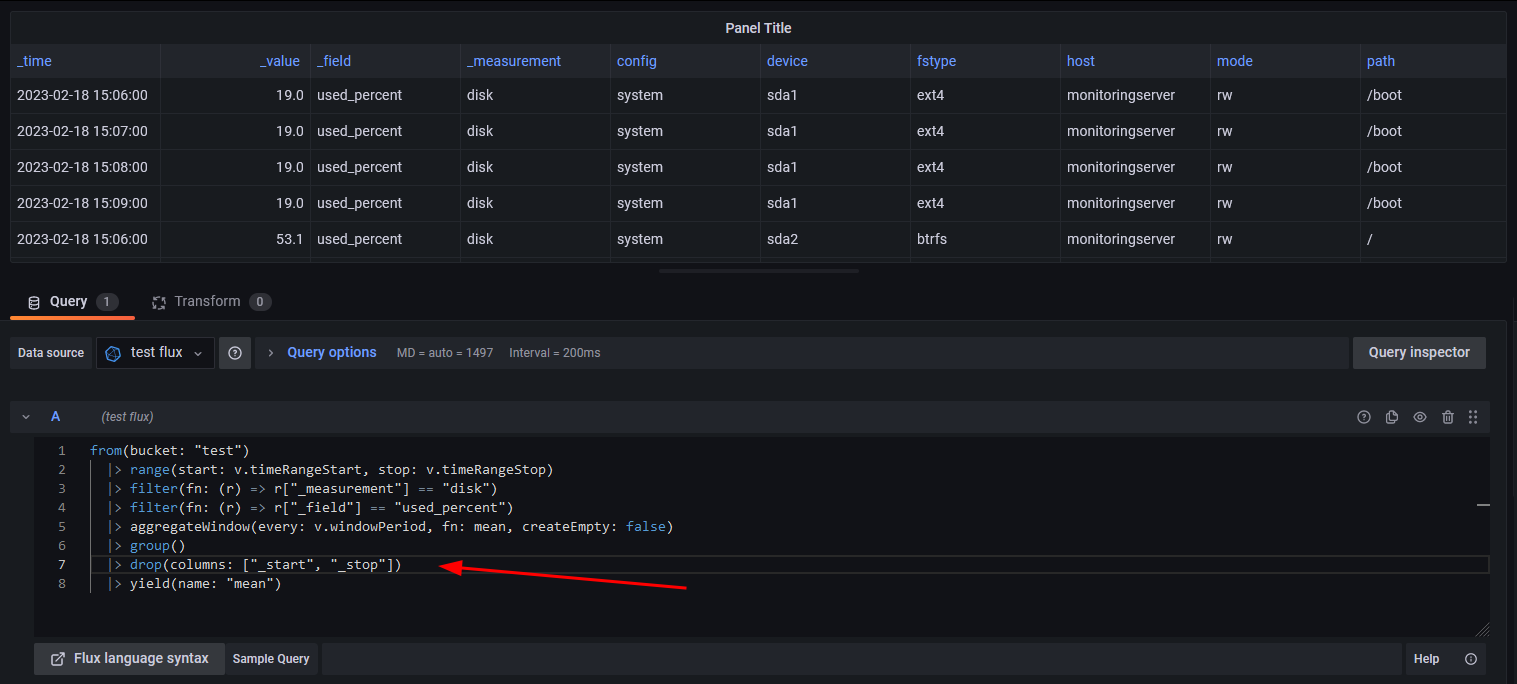
Maybe you can just ungroup data and drop _start and _stop columns?
 

Default:
Here you can see one column with all tags inside { } brackets and selection box for choosing different tables (in my case they differ in path which is filesystem name).


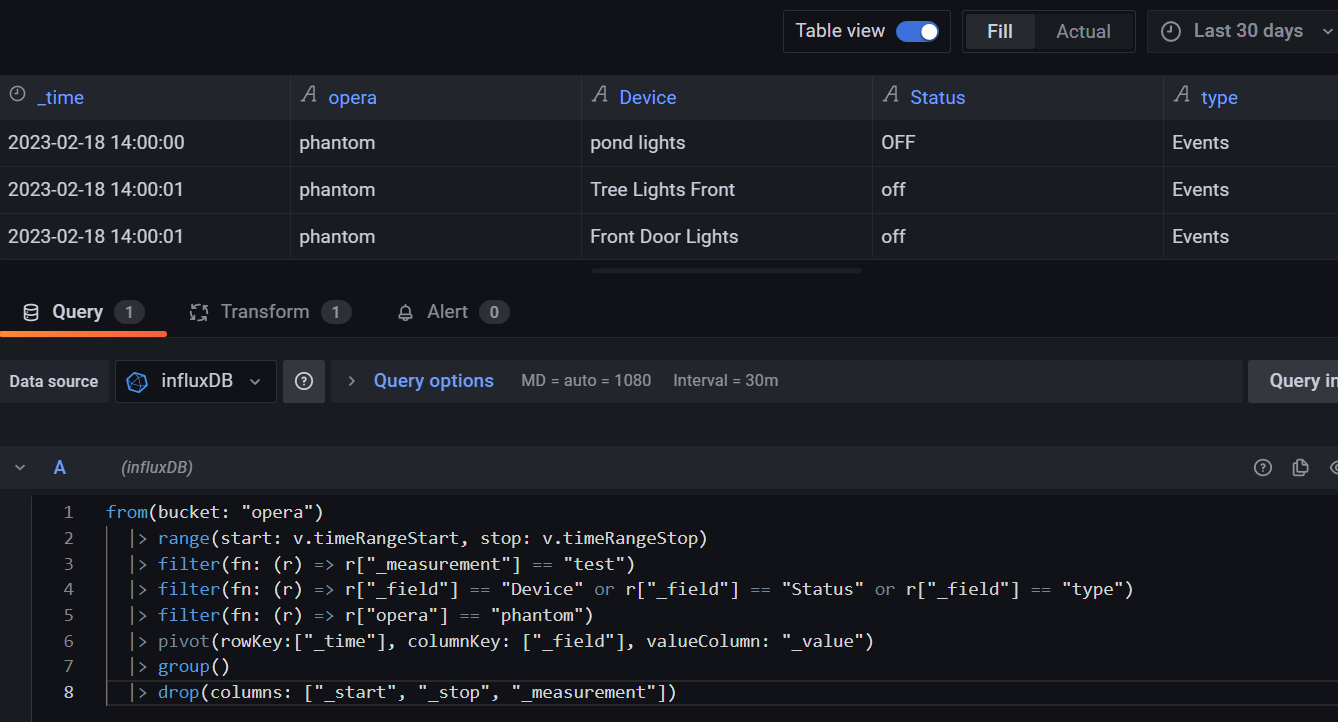
After ungrouping data ( |> group() function ) you get everything in one table (no selection box) and every tag inside { } brackets becomes a table column:


After droping columns that are not important. If you need to drop a lot of columns you can use keep() function instead:


Then you can define transformation Organize fields .


Best regards,
ldrascic

Thank you… I appreciate your time and effort.

I don’t get the same results a you…

table 1

if I ungroup I get


i.e. cloums have “{_start=xxxx” in their name

Ian

Hi @ianhud,
If {_start="YYYY-MM-DD"} is part of the column name then try using grafana transformation Rename by regex with:

Match: (.*)\s{.*
Replace: $1

This regex should extract anything that’s before bracket {. So from:

_value {_start="2023-02-18 16:12"}
Device {_start="2023-02-18 16:12"}
Type {_start="2023-02-18 16:12"}
_field {_start="2023-02-18 16:12"}
_measurement {_start="2023-02-18 16:12"}

You would get:

_value
Device
Type 
_field 
_measurement 

You can try this on www.regex101.com with flavor Golang. Here is a direct link with filled data and regex:


You can also take a look at this post for more information:


Best regards,
ldrascic

1 Like

Why is the data coming like that in first place?
Can you share data sample as csv please

I attach 2 files both generated by this code

from(bucket: "ashtreedb")
	|> range(start: v.timeRangeStart, stop: v.timeRangeStop)
  |> filter(fn: (r) => r["_measurement"] == "test")
  |> group()

The file generated by influxdb

The file generated by grafana

1 Like

Thank you Idrascic, that worked and it ‘stuck’ after data requery, thank you.

Like yosiasz, I am curious as to why grafana appends {_start="2323-02-18 etc to column names.

Ian

@ianhud, @yosiasz, @nygma2004
I found out what is causing that _start & _stop times are appended in column names.

In your query you are missing a selector (e.g. last() ) :

So if you add a last() selector before group() like this:

from(bucket: "imported")
  |> range(start: v.timeRangeStart, stop: v.timeRangeStop)
  |> filter(fn: (r) => r["_measurement"] == "test")
  |> last()
  |> group()

 
you will get correct column names (without using Rename by regex transformation):


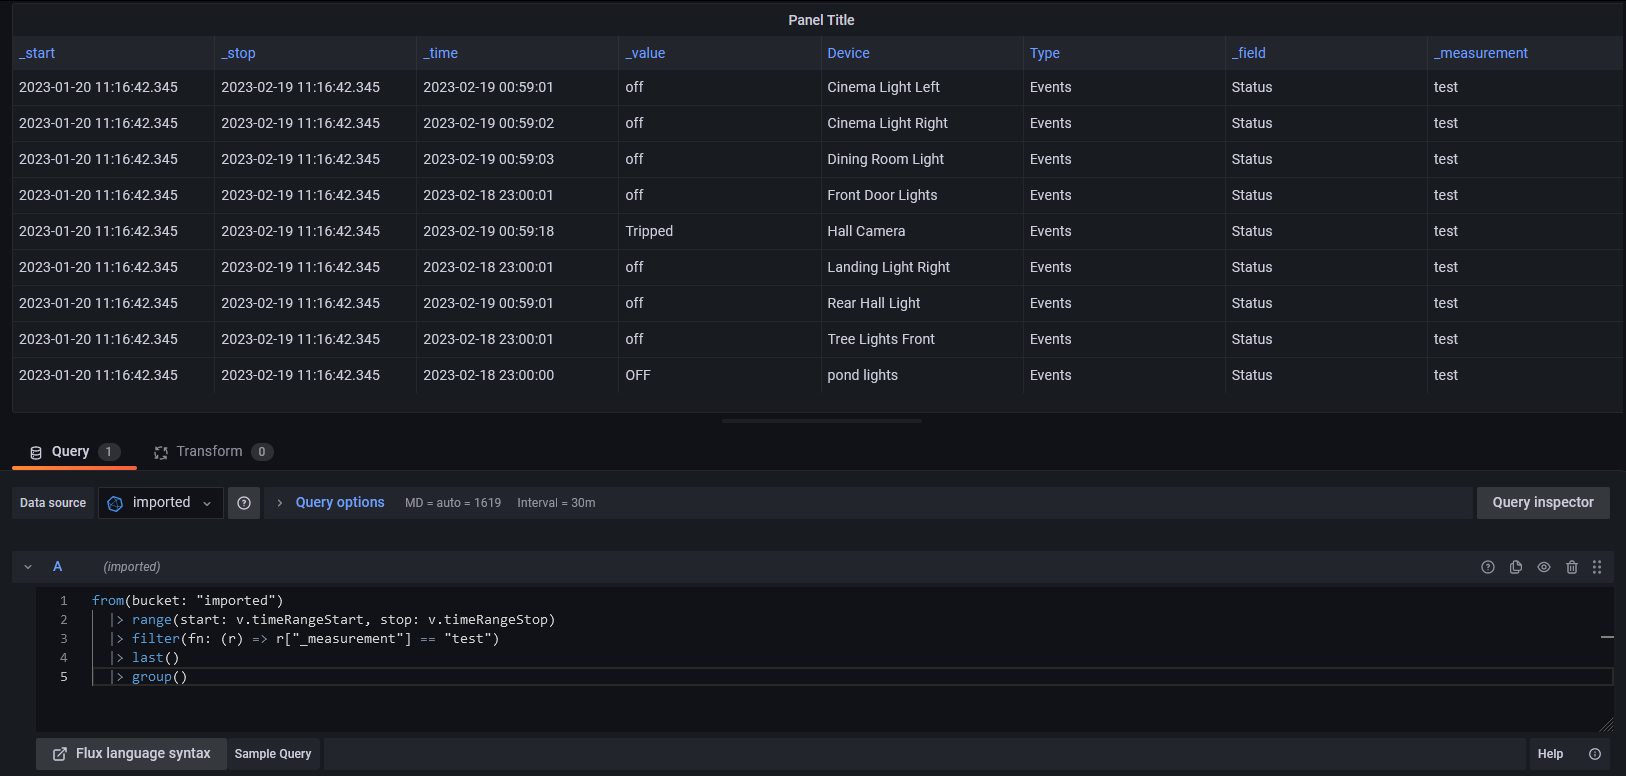
Q: Is it safe to use last() selector? Would't it print only last value?

A: In this case you will get all rows because data is grouped by _measurement, _field, _start, _stop, Device, Type. You can see that in InfluxDB if you toggle “View Raw Data” and check table header (marked with rectangle).

Be aware that when you use “View Raw Data” option in InfluxDB you will always see all results in one table but you might have stream of tables in reality (like in this case).

Now, if you set Table view in InfluxDB and turn off “View Raw Data” you will see that you in fact have a stream of tables (if you are not using group() function).

 
InfluxDB documentation for last() selector says:

last() function
last() returns the last row with a non-null value from each input table.

And since all your tables (marked with rectangle on upper picture) have only 1 row it is safe to use last() selector in this case.


Best regards,
ldrascic

1 Like

That is very kind of you to spend time investigating. I don’t think it is safe for me to use last(). It is true the data in the csv’s only had one entry per table but that is becuase they were entries from last 3 hours. If I query a longer timeframe e.g. last 24 hours then tables have multiple entries.

Thanks once again
Ian

Very kind indeed @ldrascic :clap: :clap: :clap:

I keep bookmarking your posts because you are solving problems that I will likely encounter in the future!

@ianhud,


I see… can you try grouping your data by _time and _value as well before calling last() (and after that ungroup data with group() like before )?
 

Query:

from(bucket: "imported")
  |> range(start: v.timeRangeStart, stop: v.timeRangeStop)
  |> filter(fn: (r) => r["_measurement"] == "test")
  |> group(columns: ["_measurement", "_field", "_time", "_value", "Device", "Type"], mode:"by")  
  |> last()
  |> group()

This should output multiple tables with only one row since data is grouped by _time (that would be before last() function).


Best regards,
ldrascic

Thank you so much. As far as I can see that worked. Now I need to understand why that worked!!!

That’s my job not yours. You have done more than enough and I appreciate your kindness, I would not have been able to do this on my own.

Ian

1 Like

from(bucket: "opera")
  |> range(start: v.timeRangeStart, stop: v.timeRangeStop)
  |> filter(fn: (r) => r["_measurement"] == "test")
  |> filter(fn: (r) => r["_field"] == "Device" or r["_field"] == "Status" or r["_field"] == "type")
  |> filter(fn: (r) => r["opera"] == "phantom")
  |> pivot(rowKey:["_time"], columnKey: ["_field"], valueColumn: "_value")
  |> group()  
  |> drop(columns: ["_start", "_stop", "_measurement"])

3 Likes