Hello, everyone.
I am writing some queries for counting the amount of SonarQube issues generated by developers in my company, but I don’t like the way this info is presented.
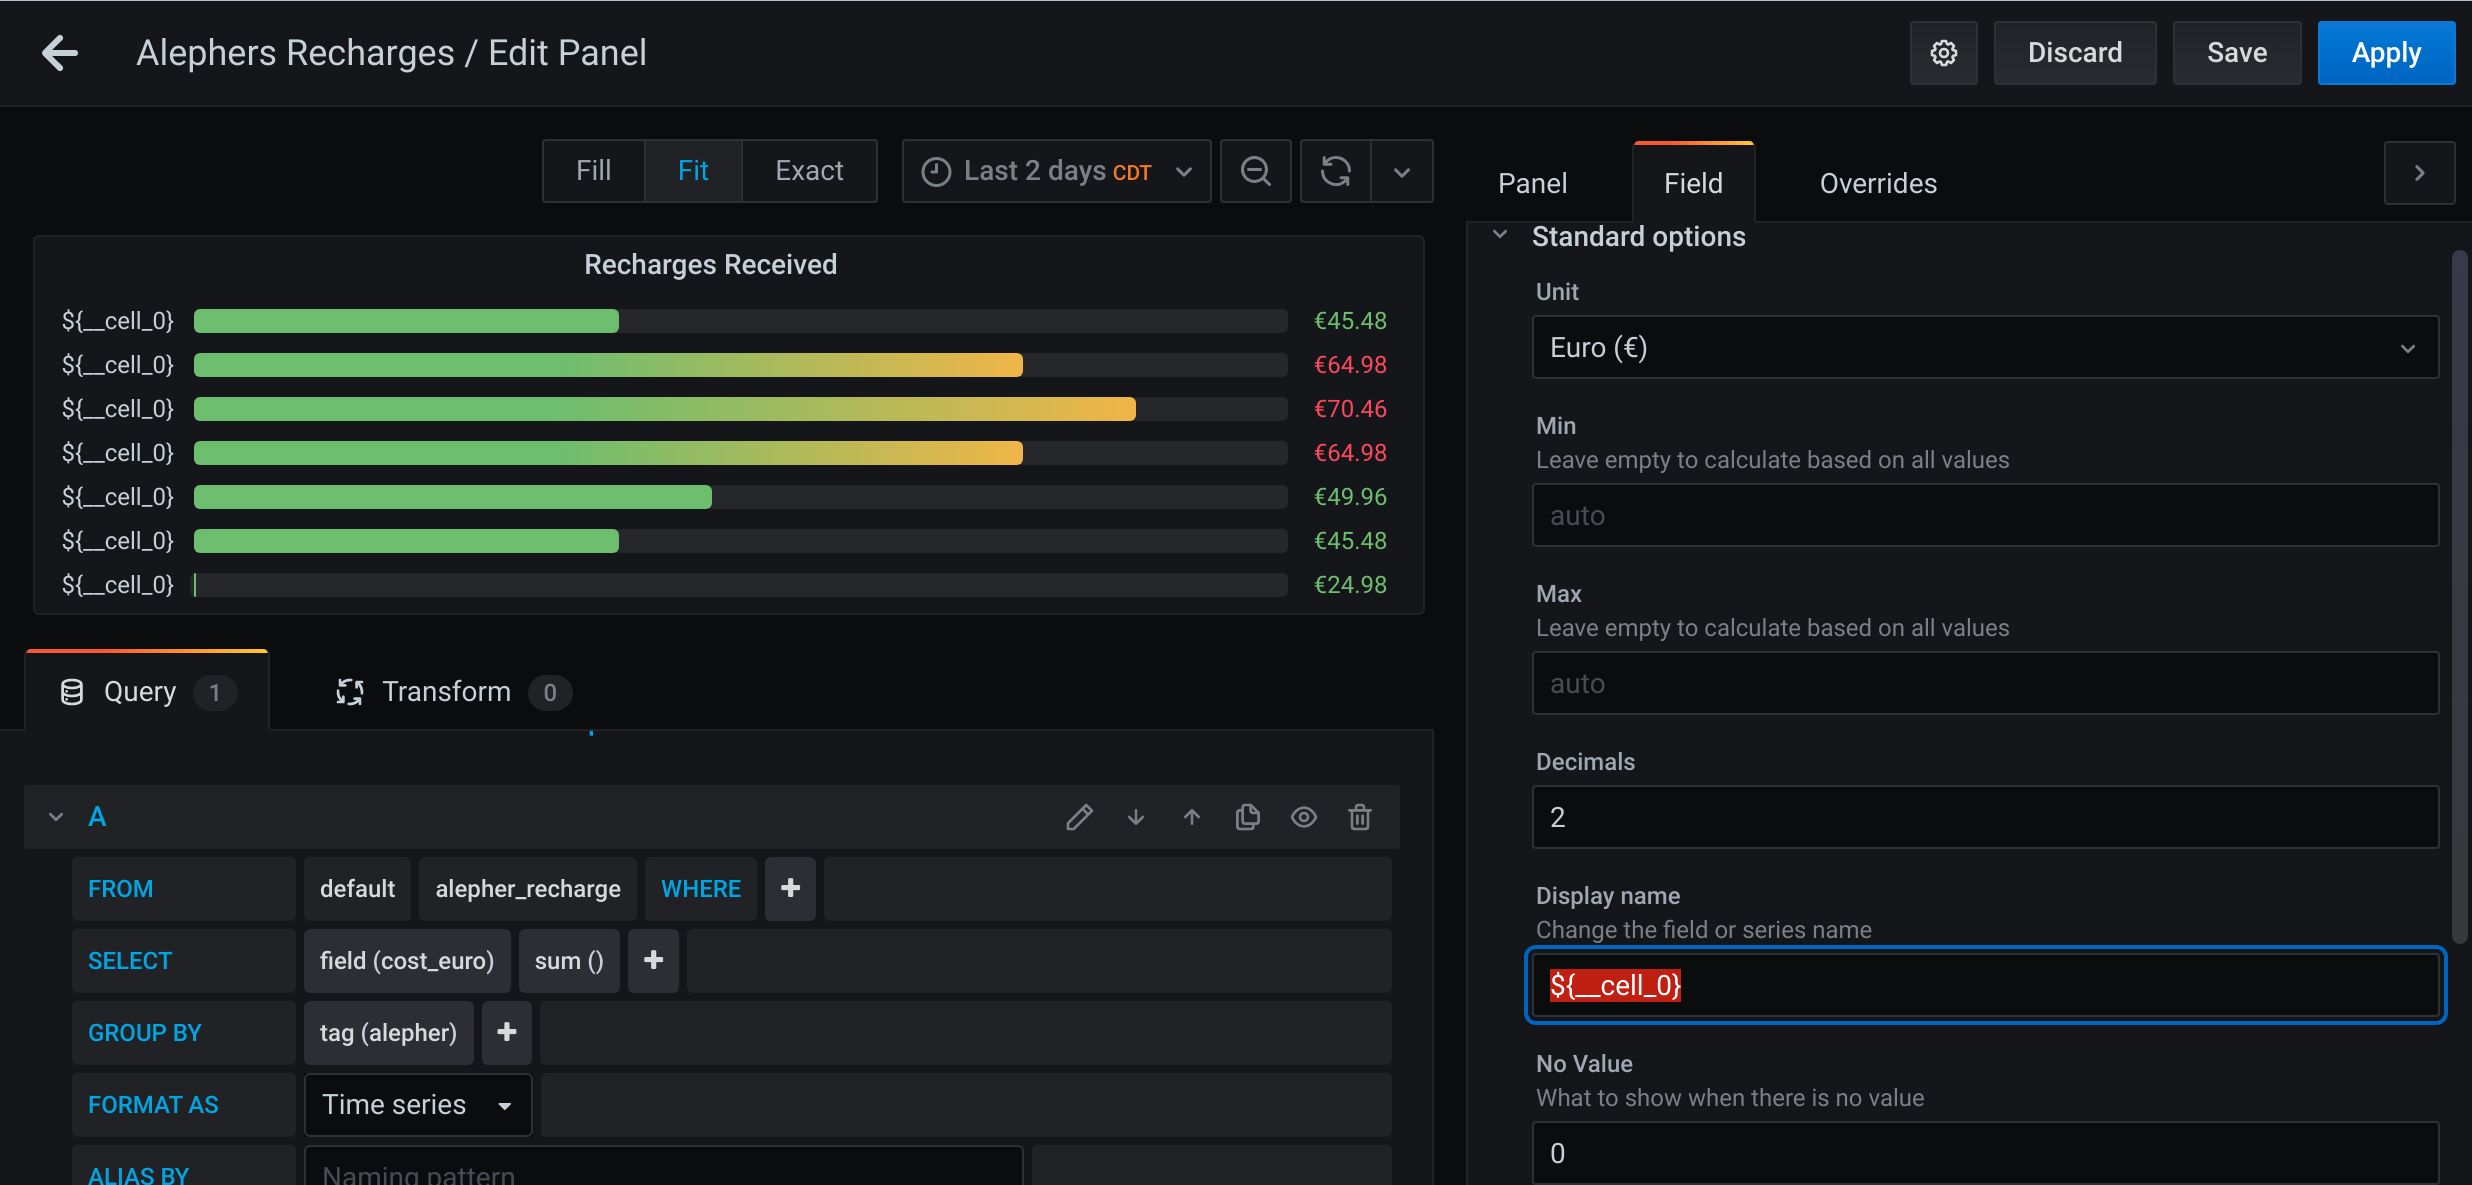
This screenshot shows one query I am executing and its results:
My question is: how can I remove all the sonar_issue_count {author: ...} surrounding data and leave only the author email on the panel? This happens for every visualization.
When using tables, I can do a static mapping between these values and the ones I want to show, but is extremely uncomfortable. And I would have to manually map every new developer that works for my company, which makes this a bad solution.
I tried to play with the ${__series.name} attribute, but it is not precise, unless I could use some functions like indexOf combined with subString. Can I?:
The problem with Organize Fields and aliases is that you need to know the name of the series that will be returned, so you can map them to the actual values you want to show.
This means when every new value comes in to play, you will have to manually map it as well, which is not very comfortable.
Anyways, if there is no other way, I guess I’ll have to work with that… thanks for your response.