How to display values from rows as data in columns in a table (using data transformation)

Hi,
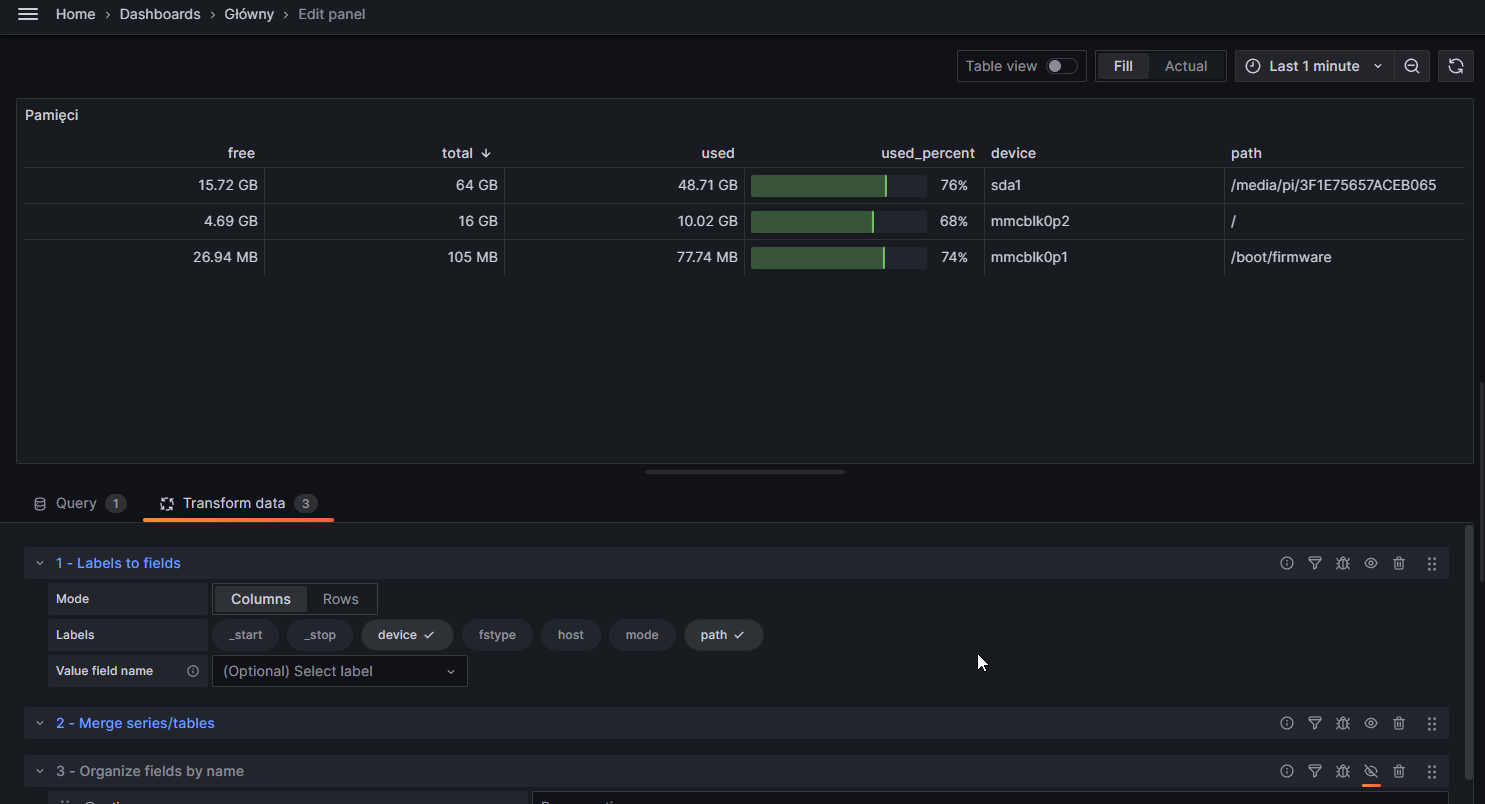
I recently started my adventure with Grafana and I need to create a panel that will show the storage status of the plugged-in drives to the server. So far, I collect data on computer usage/parameters via the Telegraf plugin and store it in the InfluxDB v2 database (Flux queries). I came across various dashboards on the Internet and a specific panel caught my particular attention.
I have read a lot about data transformation in Grafana, but I still have a problem with processing the data by which the table draws incorrectly.
First of all, I have a problem that the rows are placed as columns.

  • My Flux query is:
  from(bucket: "telegrafRaspberryPi")
  |> range(start: v.timeRangeStart, stop: v.timeRangeStop)
  |> filter(fn: (r) => r["_measurement"] == "disk")
  |> filter(fn: (r) => r["_field"] == "free" or r["_field"] == "total" or r["_field"] == "used" or r["_field"] == "used_percent")
  |> aggregateWindow(every: v.windowPeriod, fn: last, createEmpty: false)
  |> yield(name: "last")
---------------------------------------------------------------------------------------
| device    | path           | used        | free        | total       | used_percent |
---------------------------------------------------------------------------------------
| mmcblk0p1 | /boot/firmware | 77742080    | 26935296    | 104677376   | 74.3         |
| mmcblk0p2 | /              | 99036851136 | 4806443584  | 15519776768 | 67.3         |
| sda1      | /media/pi/3... | 48705605632 | 15717851136 | 64423456768 | 75.6         |
---------------------------------------------------------------------------------------
  • My Grafana version is Grafana v10.2.3 (1e84fede54)

  • I tried many other transformation options, including combining them, but unfortunately I was not able to achieve this.

  • My raw database data (without transformation) looks as follows:

  • Can you copy/paste the configuration(s) that you are having problems with?
    Yes, but what should I show? Tell me and I paste or I show configurations.

  • Did you follow any online instructions? If so, what is the URL?
    Yes, a lot. Youtube videos, Grafana transformation tutorials, etc.

Please help me. Thanks in advance.

Welcome @misiekdp to the Grafana forum.

In your Influx Data Explorer screenshot, I do not see fields for Used, Free and Total. Do you have these values for each device?

EDIT: Nevermind, I was looking in the wrong place. I think you can avoid the Grafana tranformation by massaging the data in Influx first. Have you tried using a pivot function?

Hey, thanks for reply. I have not tried to use this pivot function, although I have come across it on the Internet. Unfortunately, I don’t have much knowledge in the Flux language (I’ve always used SQL). So could you help me modify my query syntax using the pivot function?

Can you put this into Influx Data Explorer and post the screenshot?

  from(bucket: "telegrafRaspberryPi")
  |> range(start: v.timeRangeStart, stop: v.timeRangeStop)
  |> filter(fn: (r) => r["_measurement"] == "disk")
  |> filter(fn: (r) => r["_field"] == "free" or r["_field"] == "total" or r["_field"] == "used" or r["_field"] == "used_percent")
  |> pivot(rowKey: ["_time"], columnKey: ["_field"], valueColumn: "_value")
  |> aggregateWindow(every: v.windowPeriod, fn: last, createEmpty: false)
  |> yield(name: "last")

I don’t believe this but I tried to do it myself before you wrote the post and it worked! :smiley:
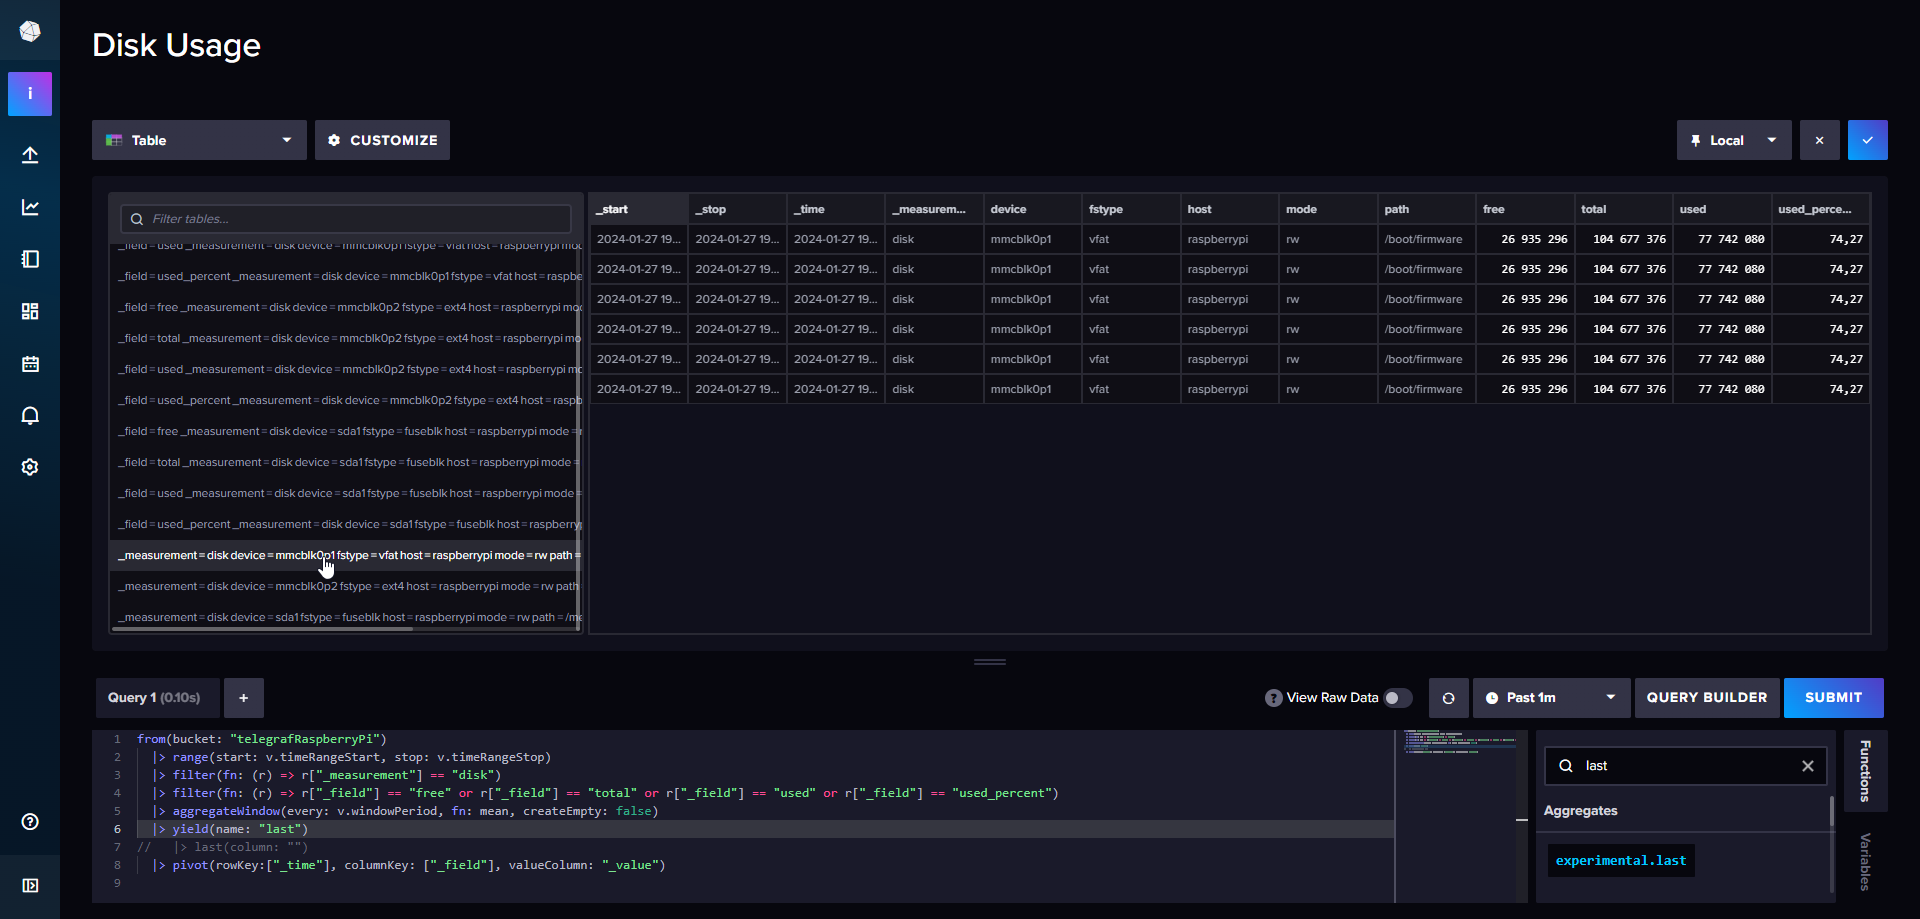
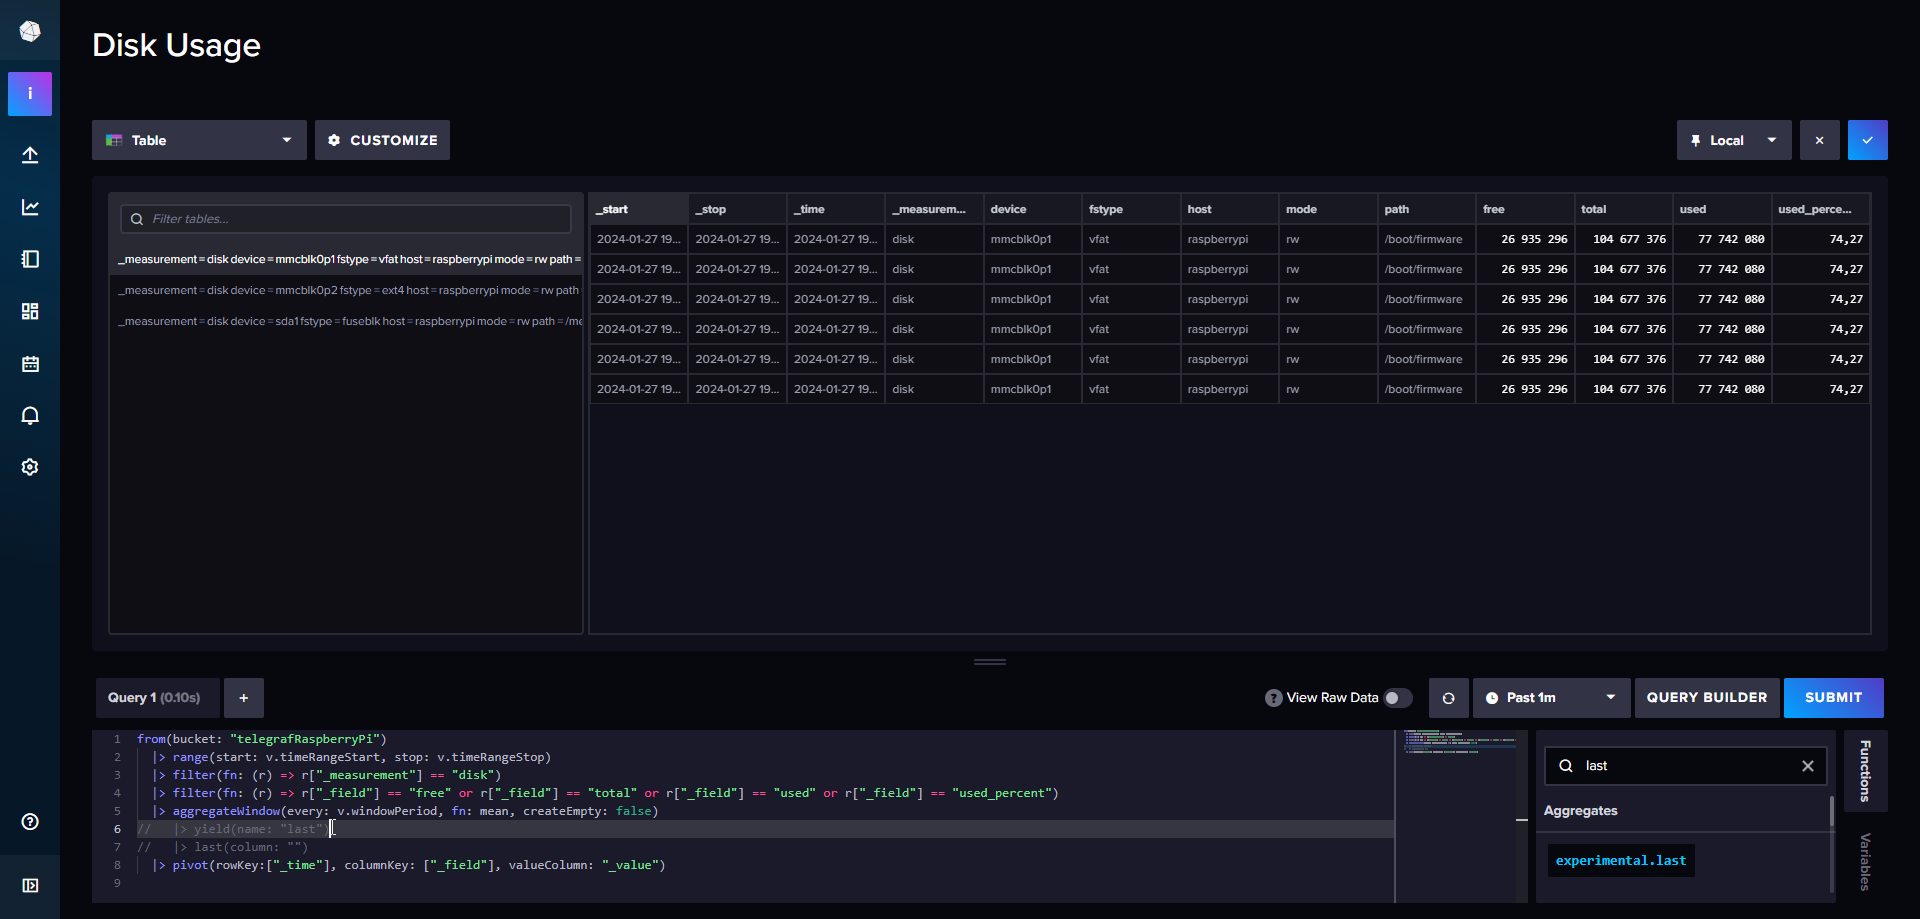
But I also have a question about the use of |> last(column: "") and |> yield(name: "last") (not sure if I used them correctly). I did some tests and when I use |> last(column: "") only one last value is shown (I think it’s a good solution, but I don’t know its disadvantages and if this field should be empty).

Below I will post some tests with |> last(column: "") and |> yield(name: "last") - if I may ask, please advise me what to improve.


And fianlly:

Hi @misiekdp and congrats on getting the solution.

If you just want the last row returned in your query, then I think this would work:

|> last()

The yield statement is just to deliver the data, and in Grafana, it’s often not even needed (although it does not hurt anything). In Influx Data Explorer, you need to put it in, usually as the last line of your query, and it can be any word in quotes, such as:

|> yield(name: "kalamazoo")

Finally, I would suggest you change the order of the statements to be as shown and make sure your query still works with this order:

....
  |> pivot(rowKey: ["_time"], columnKey: ["_field"], valueColumn: "_value")
  |> aggregateWindow(every: v.windowPeriod, fn: last, createEmpty: false)
  |> last()
  |> yield(name: "last")

Hey, thanks for reply.
I tried this order what u described but I got error.

Cześć @misiekdp

I believe that last error about no column "_value" exists is due to the way Grafana parses the result from InfluxDB. If a _value column is found, it is assumed to be a time-series. The quick workaround is to add the following rename() function. Try adding this after the pivot and see if that eliminates the error.
|> rename(columns: {_value: "something"})

Hey, still not works :smiley:
But thank you very much with trying to help.


@grant2 Do you have any more tips for the issue which I wrote above?

Hi @misiekdp

Do you still get an error message when you change lines 5, 6, & 7 to start with |> instead of -- |>

@grant2 No, with that uncommented code it works perfectly :slight_smile: But you suggested changing the order of the statement so I tried this (but without success).

Link to post

Hi @misiekdp I usually use Influx Data Explorer as the place for debugging my Flux code. I’m sorry but I cannot tell from my end what else might require changing.

1 Like

Ok, so thank you very much for your help, I was able to develop the data table as I needed. Thanks! :smiley: