Hi,
In my grafana dashboards showing metrics via queries to prometheus I see that the order of the different entries, e.g. Busy-user Busy-Idle Busy-System etc in a stacked graph keeps switching places probably depending on what values are updated. So does the legend order.
Is there a way to fix the order? I thought that the point of ordering the queries themselves up or down (A,B,C etc) would result in a given order in the graphs, but apparently not.
I would like to e.g. see the query results stacked in the following order
Busy-User
Busy-System
Busy-Nice+Steal
See attachement showing two graphs with different order of the metrics.

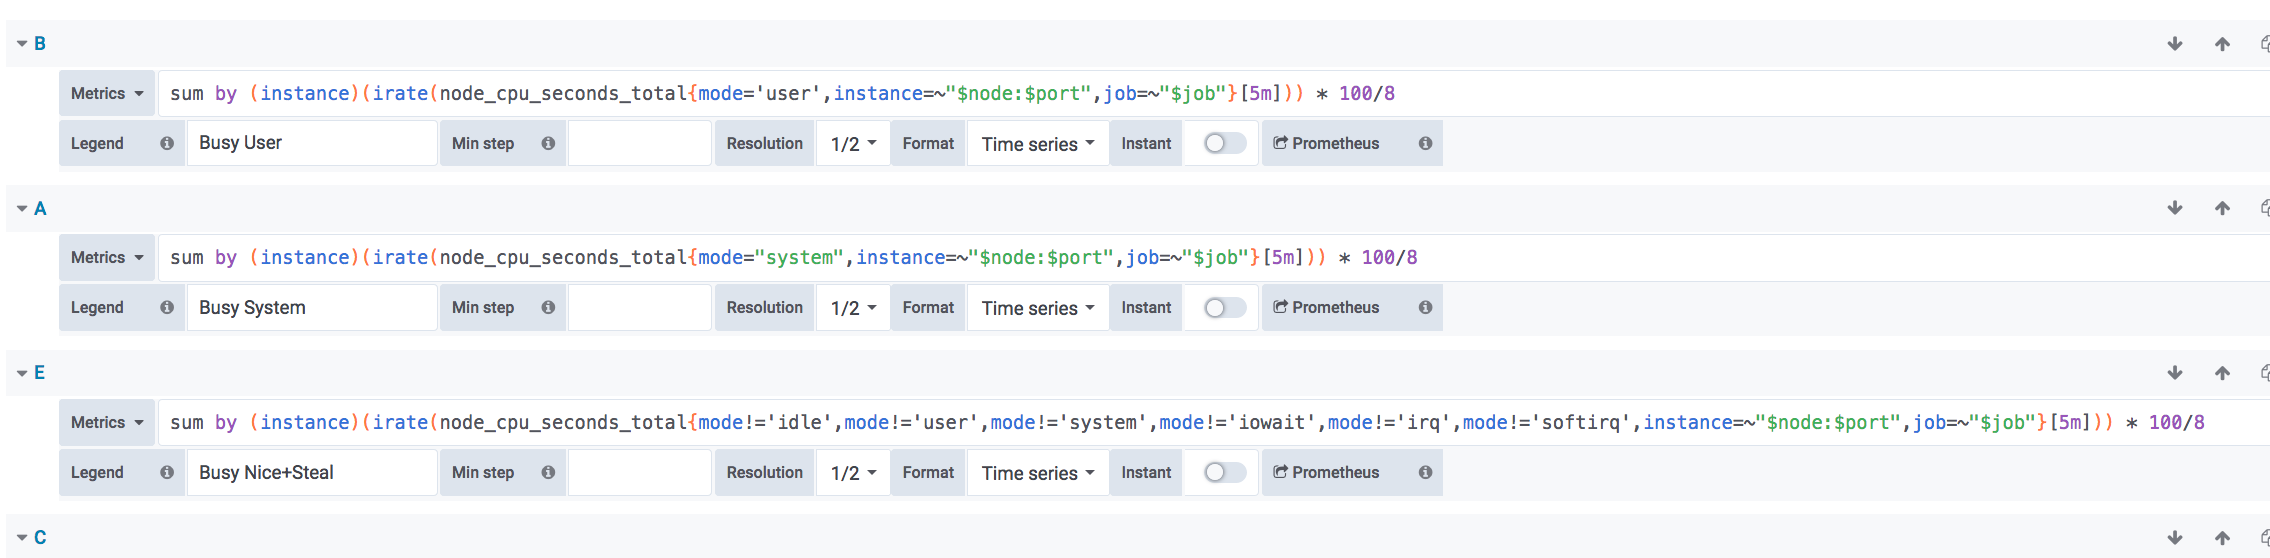
See also how I have tried to order the queries to show the desired order, but as the grafana plots show this clearly is not the right way.
Thanks!