Opensearch Data coming back as array

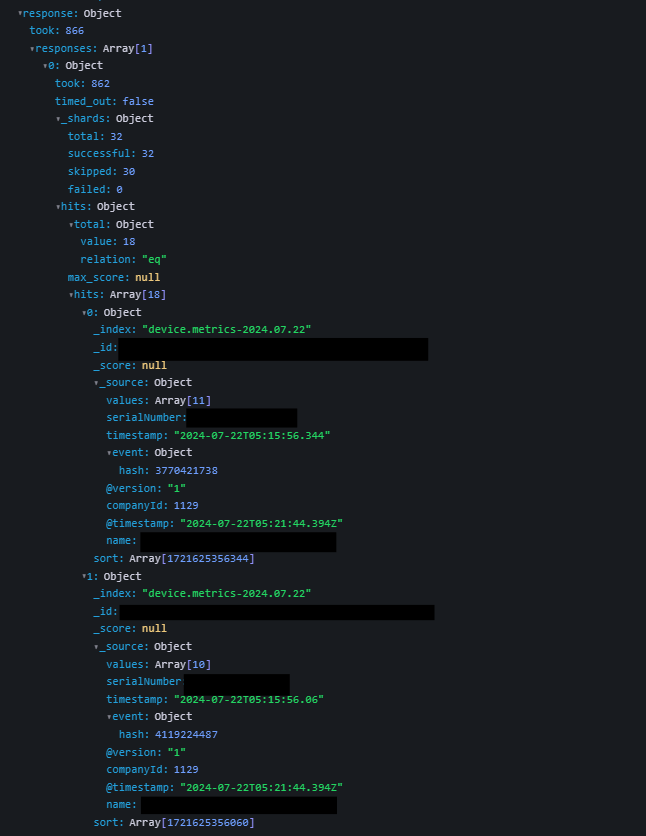
Hello. I believe my opensearch data is coming back as an array. I am not sure why, when checking my opensearch configuration I am certain that this data is of type “float”. When looking at the query inspector, I see that my result for “values” is something like Array[11], where 11 can be any value from -1 to 11.

Can someone give me any pointers as to why this data might be coming back as an array if it is indeed a float inside of opensearch?

Is this an issue with Grafana or an issue with my data source?
Example:

Opensearch configurations and example query result:

what does the data look like if you query it outside of grafana either via curl or opensearch query dashboard or kibana?


here is a screenshot from the query dashboard. Does this answer your question? I am pretty new to opensearch so apologies if this isnt what you meant:

In opensearch:

{
  "device.metrics-2024.06.06": {
    "aliases": {},
    "mappings": {
      "properties": {
        "@timestamp": {
          "type": "date"
        },
        "@version": {
          "type": "text",
          "fields": {
            "keyword": {
              "type": "keyword",
              "ignore_above": 256
            }
          }
        },
        "companyId": {
          "type": "long"
        },
        "event": {
          "properties": {
            "hash": {
              "type": "long"
            }
          }
        },
        "name": {
          "type": "text",
          "fields": {
            "keyword": {
              "type": "keyword",
              "ignore_above": 256
            }
          }
        },
        "serialNumber": {
          "type": "text",
          "fields": {
            "keyword": {
              "type": "keyword",
              "ignore_above": 256
            }
          }
        },
        "timestamp": {
          "type": "date"
        },
        "values": {
          "type": "float"
        }
      }
    },

In opensearch:

{
  "took": 637,
  "timed_out": false,
  "_shards": {
    "total": 32,
    "successful": 32,
    "skipped": 0,
    "failed": 0
  },
  "hits": {
    "total": {
      "value": 18,
      "relation": "eq"
    },
    "max_score": 8.780424,
    "hits": [
      {
        "_index": "device.metrics-2024.07.22",
        "_id": "REDACTED",
        "_score": 8.780424,
        "_source": {
          "values": [
            11
          ],
          "serialNumber": "REDACTED",
          "timestamp": "2024-07-22T04:55:09.331",
          "event": {
            "hash": 2491677931
          },
          "@version": "1",
          "companyId": 1129,
          "@timestamp": "2024-07-22T05:00:48.736Z",
          "name": "REDACTED"
        }
      },
1 Like

is this in grafana or outside of grafana?

so you are new to both grafana and opensearch?

The comments I added are in opensearch. The issue I am having is that Grafana is not reading the field “values” as a number, it is reading them as an array.
I am not new to Grafana, only to opensearch. I will update the comments

What would be the benefit of using jsonata with ininfinity plugin over the opensearch plugin? I’ve looked through the documentation for both but I do not see what the benefit of this solution might be?

Thank you for taking the time to help out though.

well for one thing, the current issue you are facing, can it be solved with opensearch plugin?. infinitiy for one thing solves your values array issue. you can do tons of stuff you cannot do in grafana nor in opensearch plugin

btw could there be a case where there could be more than one value in values array?

One last question, I see what you’re saying and I think this is the right approach to go. The only two things I am confused about is the process of querying opensearch using infinity plugin.

How do you use jsonata in conjunction with infinity plugin? I cannot find much documentation on it.

I have an example query here straight from my dev tools:

GET /device.metrics*/_search
{
  "query": {
    "bool": {
      "must": [
        {
          "regexp": {
            "name.keyword": ".*/modem-state"
          }
        },
        {
          "term": {
            "serialNumber.keyword": "1234"
          }
        }
      ]
    }
  }
}

and here is how that curl would look:

curl -XGET "http://localhost:9200/device.metrics*/_search" -H 'Content-Type: application/json' -d'
{
  "query": {
    "bool": {
      "must": [
        {
          "regexp": {
            "name.keyword": ".*/modem-state"
          }
        },
        {
          "term": {
            "serialNumber.keyword": "1234"
          }
        }
      ]
    }
  }
}'

How would I put this into infinity plugin. I have tried a few different configurations but cannot figure it out. It does seem to work when using a simpler query such as:

https://localhost:9200/device.metrics*

@yosiasz

1 Like

read the documentation ,try it out and post when stuck

first infinity

https://grafana.github.io/grafana-infinity-datasource/docs/uql

jsonata docu
https://docs.jsonata.org

Other threads in this forum for es and os