I use the version 2.6.0
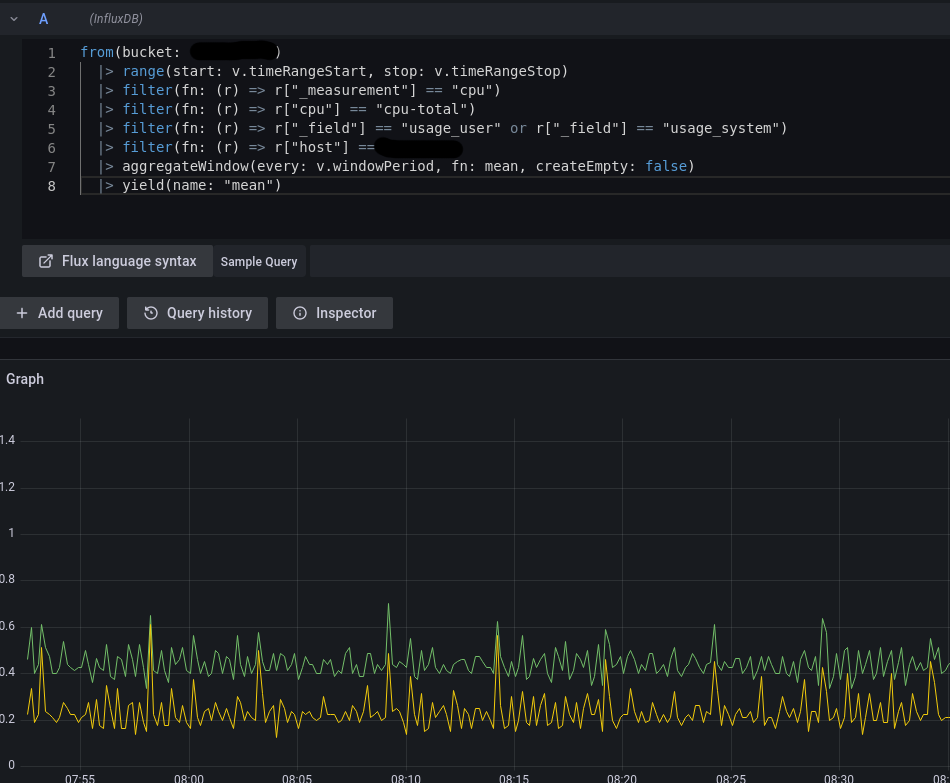
In the webui of influx I see the data, only in grafana nothing is displayed
Influx:
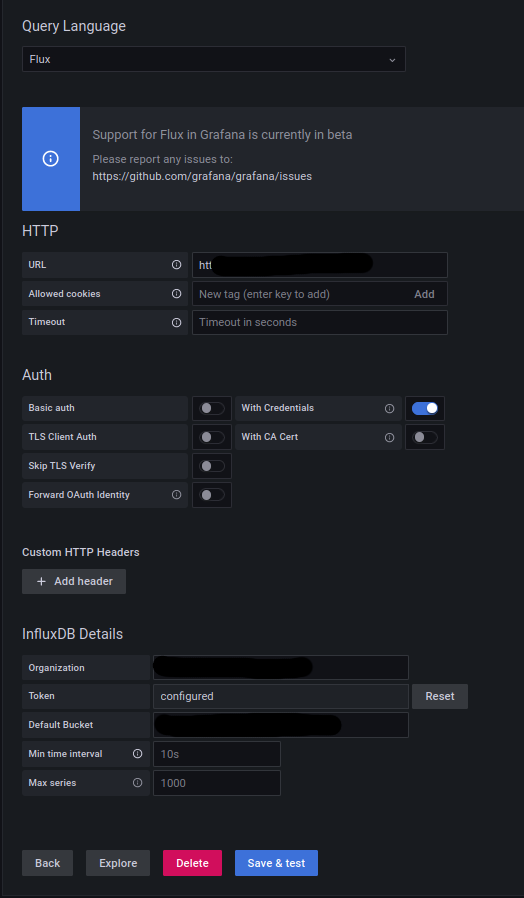
Grafana:
What could be the reason for this?
yosiasz
2
Welcome
Could you please show us the actual query that is not working?
What you are showing us is just the connection configuration
Oh sry,
I have tested the influx command, it works.
but I do not have this dropdown with which you can select the individual values
As an example:
But the data can be requested
Please tell me I don’t need to change to version 1.8, there must be a better solution to show the dropdown