No "ALIAS BY" when using flux?

Hello all.

I am trying to set an “ALIAS BY” using flux lang. However I do not see an option to do so. Is this option implemented yet? It is implemented if I use influxql, but the option is not available when I change the data source to flux.

InkedCapture3_LI

Thanks to all who reply in advance.

2 Likes

Same question here (https://github.com/grafana/influxdb-flux-datasource/issues/42).

I’ve tried using |> yield(name: "alias") but that didn’t help either.

Did you managed to solve that problem in some easy way?
I do have graphs of the same data soruce (solar energy) with time shifts where I compare Today, Yesterday and Same Day year ago. and the results look terible and confusing.

This is the only topic I’ve found on this issue and can’t tell if it’s been resolved.

Using influxDB Cloud/Flux query language trying to rename the results of queries to be human friendly on the legend. Is there a command/method for this available in grafana?

1 Like

Hi there,

the comment at https://github.com/grafana/influxdb-flux-datasource/issues/42#issuecomment-532402207 outlines a solution to this.

With kind regards,
Andreas.

Hi there,

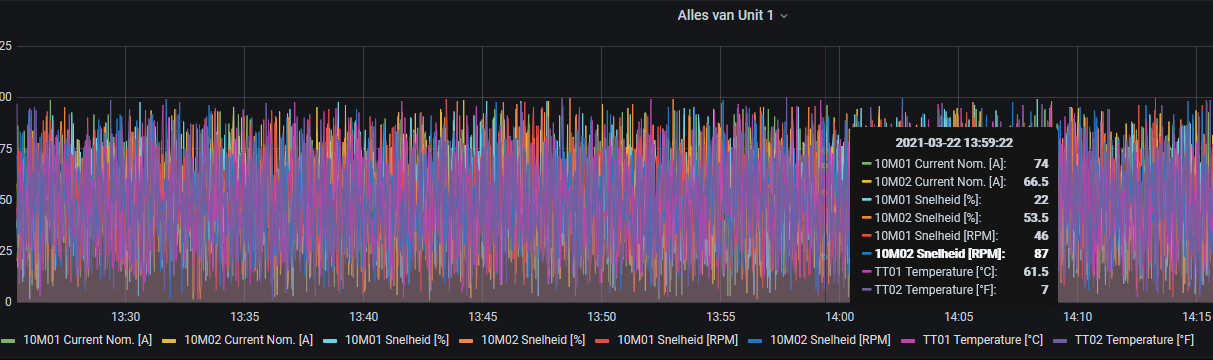
I used the display name function of grafana to define my own name:

${__field.name} ${__series.name} [${__field.labels.Eenheid}]

afbeelding

The result is shown below:

2 Likes

Nice!

  |> filter(fn: (r) => r["entity_id"] == "buffer_tap_water_in_temperature" or r["entity_id"] == "buffer_tap_water_out_temperature")
  |> aggregateWindow(every: v.windowPeriod, fn: mean, createEmpty: false)
  |> map(fn: (r) => ({  r with name: r.entity_id }))

works perfectly with

${__field.labels.name}
2 Likes

can you explain how to use this?
I’ve tried using it but it is not working.

if have the following ‘querry’

from(bucket: “PowerMonitoring”)
|> range(start: v.timeRangeStart, stop: v.timeRangeStop)
|> filter(fn: (r) => r["_measurement"] == “Current”)
|> aggregateWindow(every: v.windowPeriod, fn: mean, createEmpty: false)
|> yield(name: “mean”)

this gives back 4 values ( I1, I2, I3, IAvg) in grafana
but i would like to have it renamed ‘I Line 1’, ‘I Line 2’, ‘I Line 3’ and ‘I Average’
What do I need to do?
I think Grafana should work out the possibility to rename where we can also change the colors of the values (i think ‘alias’ in flux is difficult since we have multiple values from one ‘querry’ )

Used this:

    from(bucket: "home_assistant")
      |> range(start: v.timeRangeStart, stop: v.timeRangeStop)
      |> filter(fn: (r) => r["entity_id"] == "boiler_system_pressure" or r["entity_id"] == "auxiliary_water_pressure")
      |> filter(fn: (r) => r["_field"] == "value")
      |> aggregateWindow(every: v.windowPeriod, fn: mean, createEmpty: true)
      |> fill(usePrevious: true)
      |> map(fn: (r) =>  ({
        r with name:
          if r.entity_id == "auxiliary_water_pressure" then "Auxilary water pressure"
          else "Boiler system pressure"
        })
      )
      |> yield(name: "mean")

I really do not like the solution, however it is the only one I could come up with when there are multiple values in the same query.

Make sure to set the field value in Grafana to “${__field.labels.name}” - in order to make sure the name field is used as the label

I’ve got a query that looks like:

from(bucket: "/primary-bucket")
|> range(start: v.timeRangeStart, stop: v.timeRangeStop)
|> filter(fn: (r) => r._field == "completed_builds" or r._field == "avg_duration")
|> pivot(rowKey:["_time"], columnKey: ["_field"], valueColumn: "_value")
|> cumulativeSum(columns: ["completed_builds", "avg_duration"])
|> map(fn: (r) => ({ r with avg_build: 
        if not exists r.avg_duration or r.completed_builds == 0.0 then 0.0
        else float(v: r.avg_duration) / float(v: r.completed_builds)
}))

and gives me a graph like this:

Each line is a _measurement. Is anyone familiar with a way to change the legend name to the _measurement it is representing. I tried the grafana name function method above, but no luck.

Thanks in advance!

Hi, anyone? Having the same issue here, using:

from(bucket: "test")
  |> range(start: v.timeRangeStart, stop: v.timeRangeStop)
  |> filter(fn: (r) => r["_measurement"] == "Voltages")
  |> filter(fn: (r) => r["Name"] == "Office")
  |> filter(fn: (r) => r["Device"] == "RPI")
  |> filter(fn: (r) => r["_field"] == "gauge")
  |> group()
  |> aggregateWindow(every: v.windowPeriod, fn: mean, createEmpty: false)
  |> map(fn: (r) => ({  r with name: r.Device }))
  |> yield(name: "mean")

Also having ${__field.labels.name} as “Display name” in my grafana (v7.5.6).
The legend shows: ${__field.labels.name} in stead of “RPI” :slightly_frowning_face:

I can map like this:

map(fn: (r) => ({ r with name: “RPI” }))

which works (with using ${__field.labels.name} as "Display name"in grafana)

But I can have multiple devices and want to be flexibel with the legend names (“RPI-01”, “RPI-02”, etc…)

I’m getting the feeling this is not possible at the moment with flux.
Kind regards and thanks in advance too!
Oscar.

Oops, answered my own question:

from(bucket: “test”)
|> range(start: v.timeRangeStart, stop: v.timeRangeStop)
|> filter(fn: (r) => r[“_measurement”] == “Voltages”)
|> filter(fn: (r) => r[“Name”] == “Office”)
|> group(columns: [“Device”])
|> aggregateWindow(every: v.windowPeriod, fn: mean, createEmpty: false)
|> yield(name: “mean”)
Works! :slight_smile: (and no “Display name” needed in grafana)

Hi,

Maybe try:

group(columns: [“completed_builds”]) ?

Kind regards,
Oscar.

I’ve been using set():

from(bucket: "bvpisync")
  |> range(start: v.timeRangeStart, stop: v.timeRangeStop)
  |> filter(fn: (r) => r["host"] == "BvPiSync")
  |> filter(fn: (r) => r["_measurement"] == "vcgencmd_clock")
  |> filter(fn: (r) => r["_field"] == "arm")
  |> aggregateWindow(every: v.windowPeriod, fn: mean)
  |> set(key: "_field", value: "cpu")

And for “Display name” I use: ${__field.name}

1 Like

This is especially troublesome when having multiple queries and be unable to distinguish between “Values”

image

Also, set(key: "_field", value: "LABEL") does not work on multiple queries, why?

1 Like

Hi, facing the same issue. Wondering if you ever found a properly working solution for this. Much appreciated!

Welcome @wouterjansen to the Grafana forum.

So while it is definitely a bummer that Flux does not have the ‘alias’ option like InfluxQL did in Grafana, I have found that using the Overrides is perfectly acceptable.

2 Likes

Thanks for the welcome and for getting back on this. Also tried to work with the overrides but as soon as I do some transformations on the data (like combining two or more queries into 1 final result) all queries are named _value or Value making them hard to distinguish using the override option. Tried all kinds of solutions such as setting the _field via a map or set command and using the suggested ${__field.name} as name override but without any luck. Really frustrating since this should be something so easy to do.

A few tricks that I’ve learned in converting influxql queries to flux queries for grafana with regards to alias by, in addition to what others have written here. It’s best to use the influxdb v2 web interface > Explore, to test queries and achieve the results you are looking for, because the query results that grafana displays are slightly modified (for example, _field is not displayed as _field when _time is present in the result set):

  1. To my knowledge, you can only insert variable text (from grafana or influx row values) as column names by setting _field to the variable text (using set() or map(), I prefer map()) and using pivot. As far as I’m aware, pivot() is the only way to convert values (such as values of _field) into column names. Here’s an example of the a possibility:
...
|> map(fn: (r) => ({
  _time: r._time
  _field: "text here" + r.column_name + " more text ${grafana_dashboard_variable}" + " etc"
  _value: r._value * 8.0 / 1000
}))
|> pivot(rowKey: ["_time"], columnKey: ["_field"], valueColumn: "_value")
|> group(columns: ["_field"]
  1. Pivot in #1 above requires _time to be present in the data set. For aggregation functions such as sum() or mean(), _time is removed. In influxql, epoch 0 was returned as time along with the result. In flux, _time is dropped. When using _field, grafana expects a time result to be present, otherwise it won’t use _field correctly. You can add fake time back into the data set after the aggregation function in flux and pivot using the fake time to achieve the result you are looking for. The flux time() function is used to add epoch 0 back in the result:
...
|> sum()
|> map(fn: (r) => ({
  _time: time(v: 0)
  _field: ${grafana_dashboard_variable}
  _value: r._value
})
|> group(columns: ["enough_column_names_to_make_each_row_a_separate_group", "column1", "column2", "column3"])
|> pivot(rowKey: ["_time"], columnKey: ["_field"], valueColumn: "_value")
|> group()
  1. You can’t make variable names as keys when using map(), like this below. You must set _field instead and pivot
//This doesn't work
...
|> map(fn: (r) => ({
  "Some text " + r.some_column: r._value
}))
1 Like

Thank you for writing up all those examples. Really helpful!

1 Like