Hello everyone,
I’m using a fairly straightforward implementation of Grafana but for some reason I’m failling to get the metrics from Prometheus via UI (although they work on the terminal).
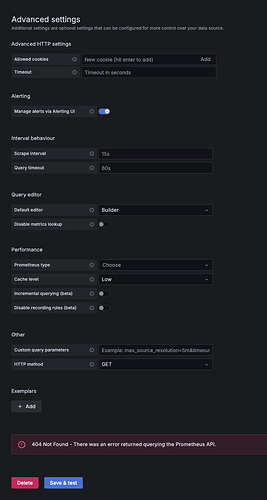
Prometheus DS error is a 404 like it can be seen on the printscreens bellow.
My configuration url is truncated on the screenshot but it’s:
http://rtcs-gateway.movebeyond-scc-dev.svc.cluster.local:8081/management/prometheus
However, everything works when I retrieve the data from the grafana pod directly:
➜ grafana#] kubectl exec -it grafana-666b7c8856-drbdl – curl -v http://rtcs-gateway.movebeyond-scc-dev.svc.cluster.local:8081/management/prometheus
- Host rtcs-gateway.movebeyond-scc-dev.svc.cluster.local:8081 was resolved.
- IPv6: (none)
- IPv4: 172.30.17.84
- Trying 172.30.17.84:8081…
- Connected to rtcs-gateway.movebeyond-scc-dev.svc.cluster.local (172.30.17.84) port 8081
GET /management/prometheus HTTP/1.1
Host: rtcs-gateway.movebeyond-scc-dev.svc.cluster.local:8081
User-Agent: curl/8.9.0
Accept: /
- Request completely sent off
< HTTP/1.1 200 OK
< Expires: 0
< Cache-Control: no-cache, no-store, max-age=0, must-revalidate
< X-XSS-Protection: 1; mode=block
< Pragma: no-cache
< Date: Tue, 06 Aug 2024 12:20:55 GMT
< Connection: keep-alive
< X-Content-Type-Options: nosniff
< Content-Type: text/plain;version=0.0.4;charset=utf-8
< Content-Length: 128824
<
# HELP hikaricp_connections Total connections
# TYPE hikaricp_connections gauge
hikaricp_connections{pool=“Hikari”,} 8.0
# HELP logback_events_total Number of error level events that made it to the logs
# TYPE logback_events_total counter
logback_events_total{level=“warn”,} 11376.0
logback_events_total{level=“debug”,} 22712.0
logback_events_total{level=“error”,} 1060.0
logback_events_total{level=“trace”,} 0.0
logback_events_total{level=“info”,} 698694.0
(…)
As you can see on the headers, there is no auth whatsoever because 1) I’m only testing for now and 2) I’m going for the pod endpoint directly.
Here are my implementation details:
Grafana version: Grafana v11.1.3 (da5a557b6e)
Grafana configuration:
One thing that I’m thinking is that, unlike the info that was shared with me, these metrics are not in Prometheus format so the datasource configuration returns a 404 directly. But shouldn’t I be getting another error instead?
I’m really confused because I’m reaching to the service directly, with no auth in the way. Shouldn’t this be failling on both terminal and UI? I’ve also changed the HTTP method to GET in order to match my curl headers.
Any help would be appreciated. Thanks in advance.
Best regards,
João Santos

