Hi Team,
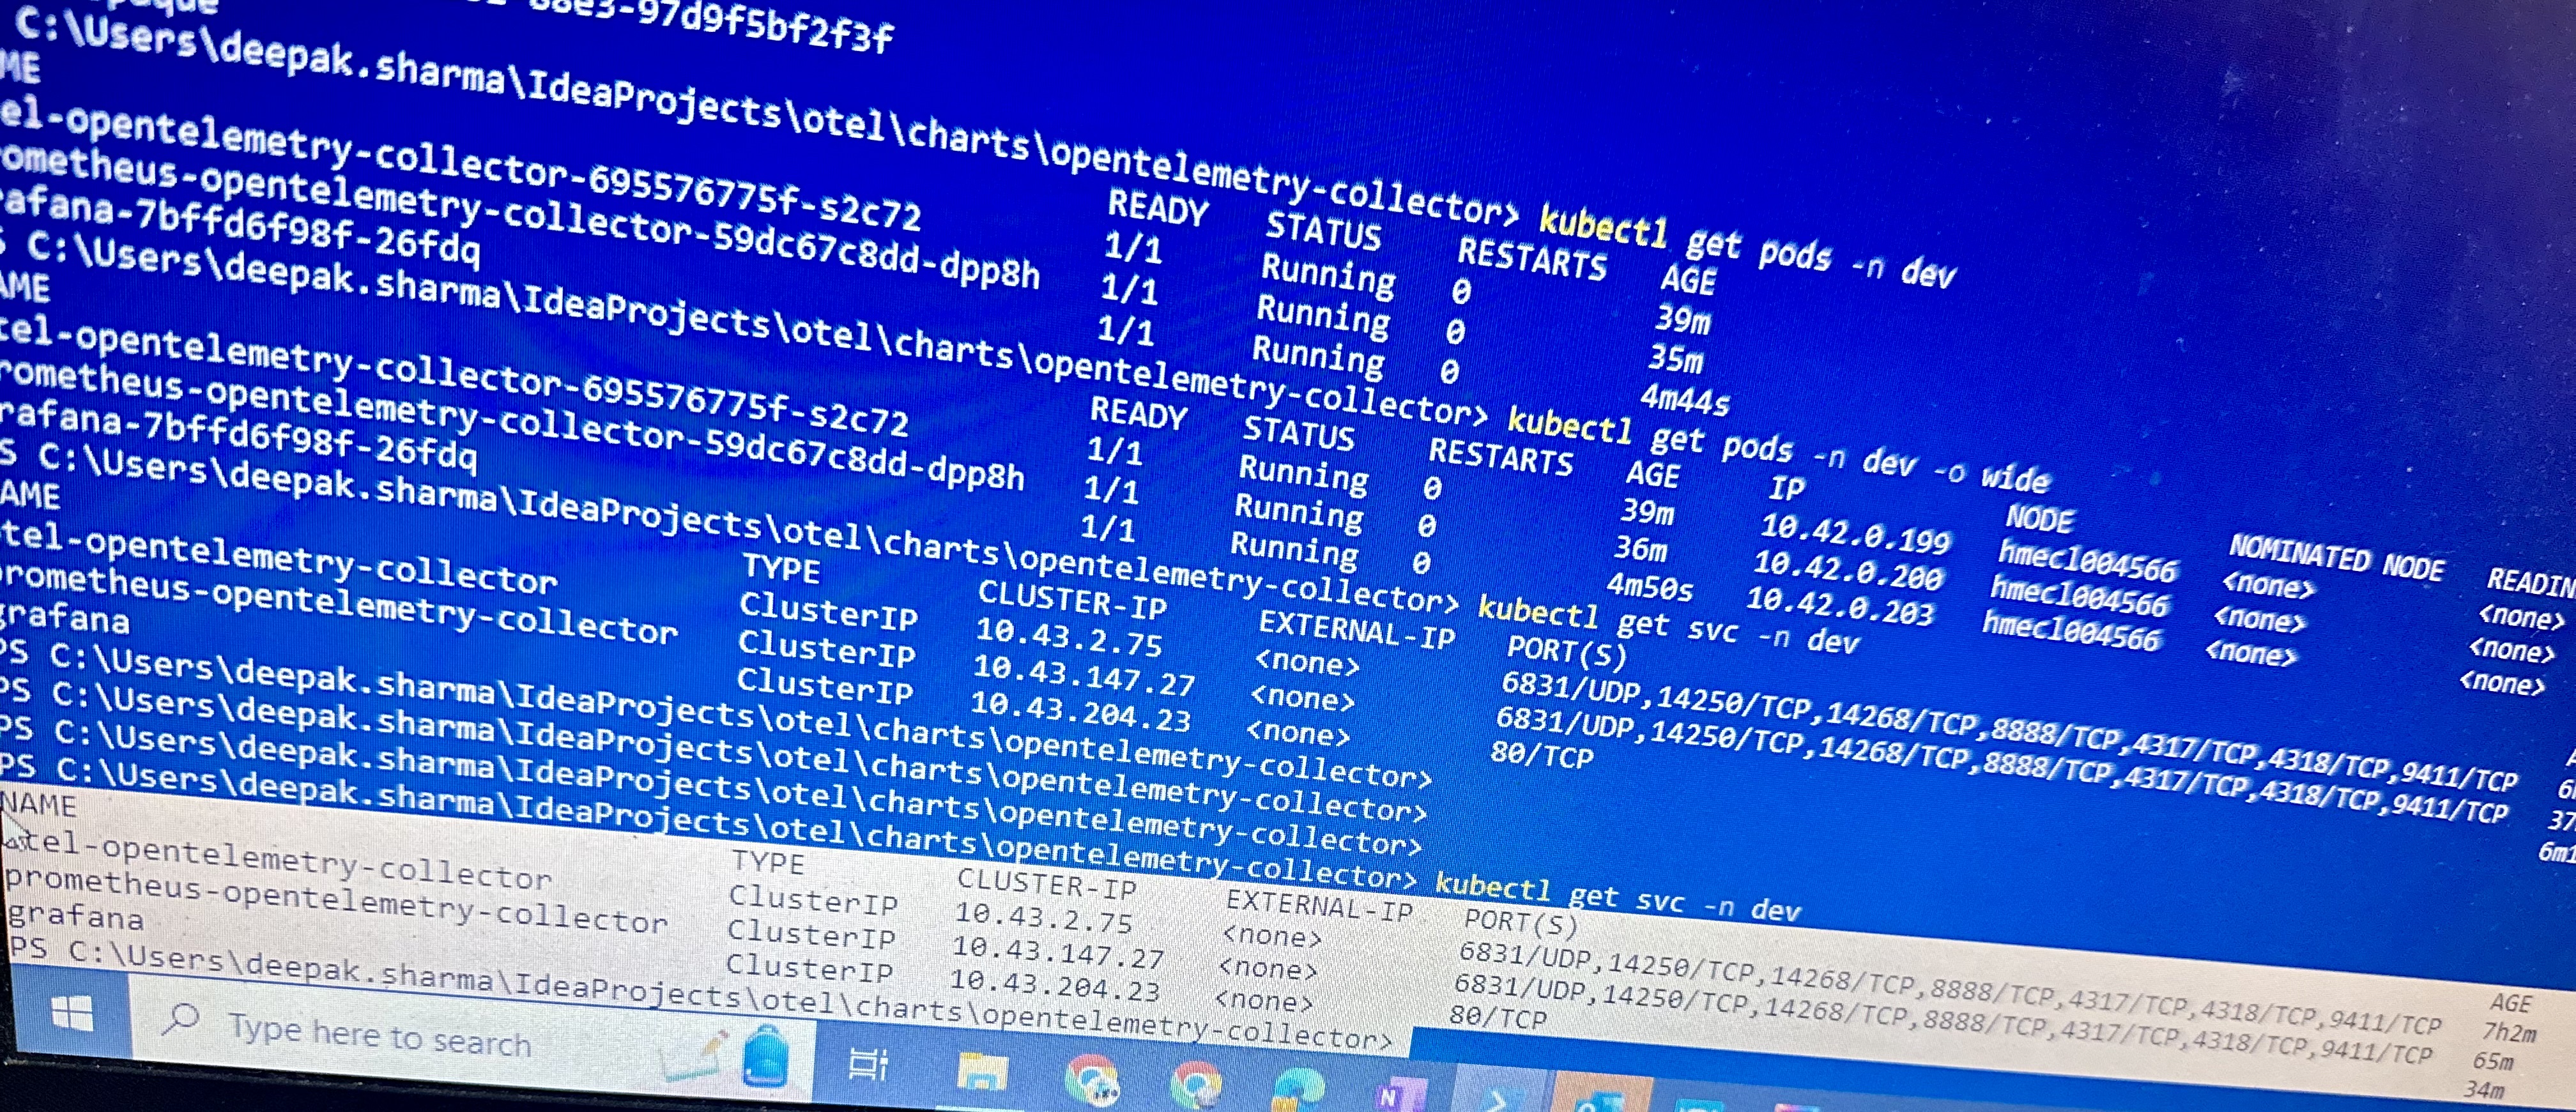
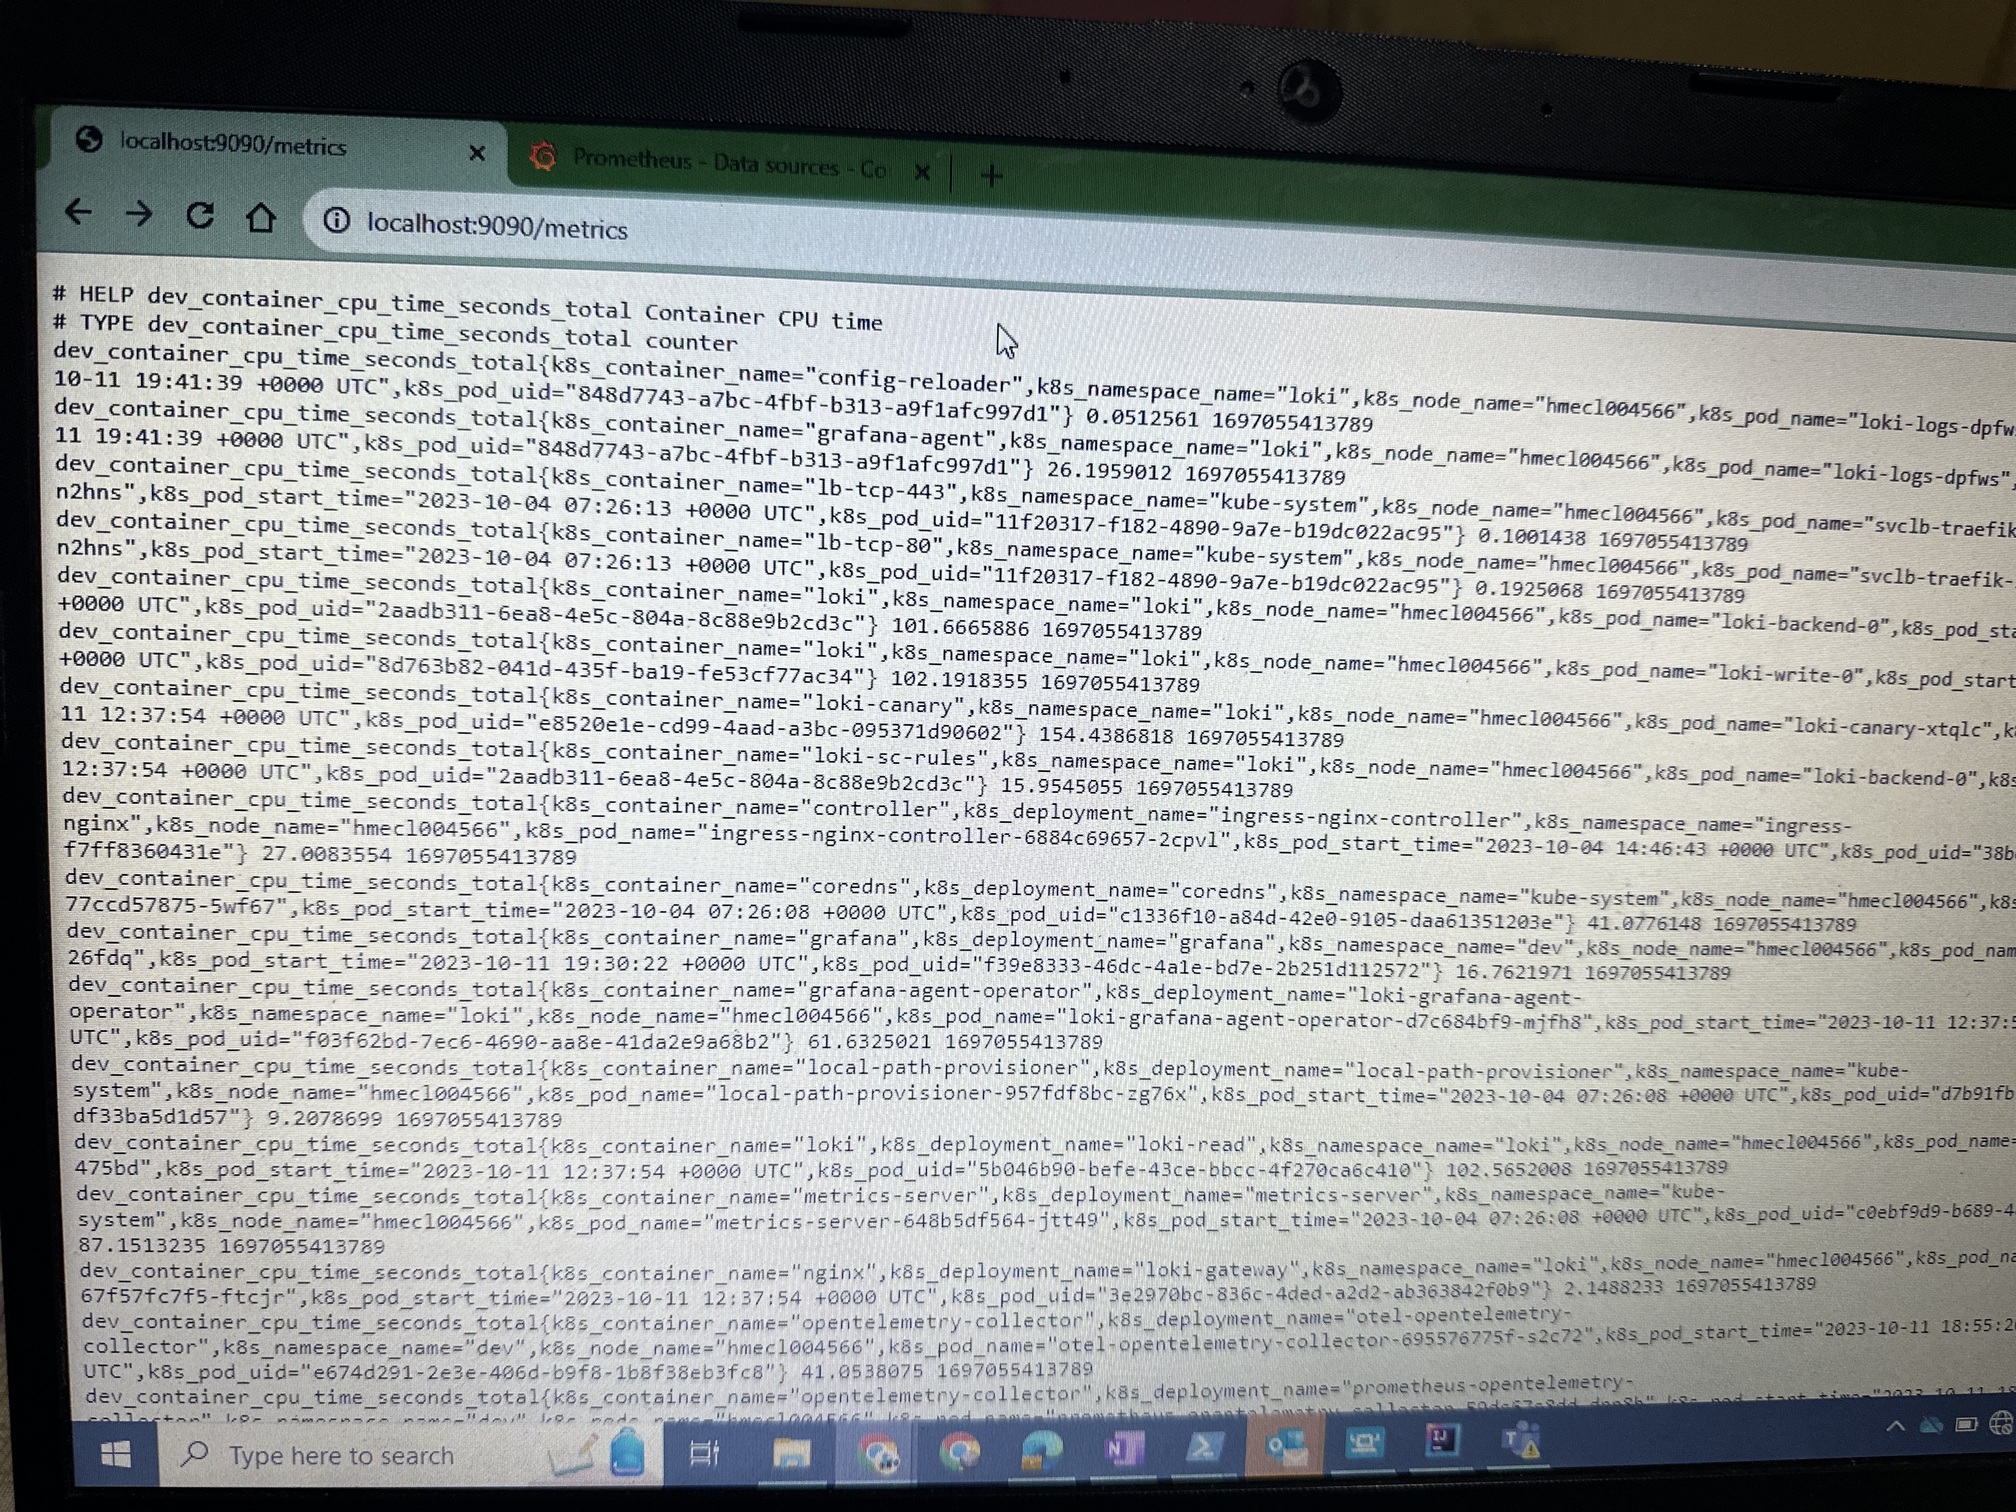
I am scrapping the otel k8s metrics and using Prometheus and Prometheus is exporting them on:
“http://localhost:9090/metrics”
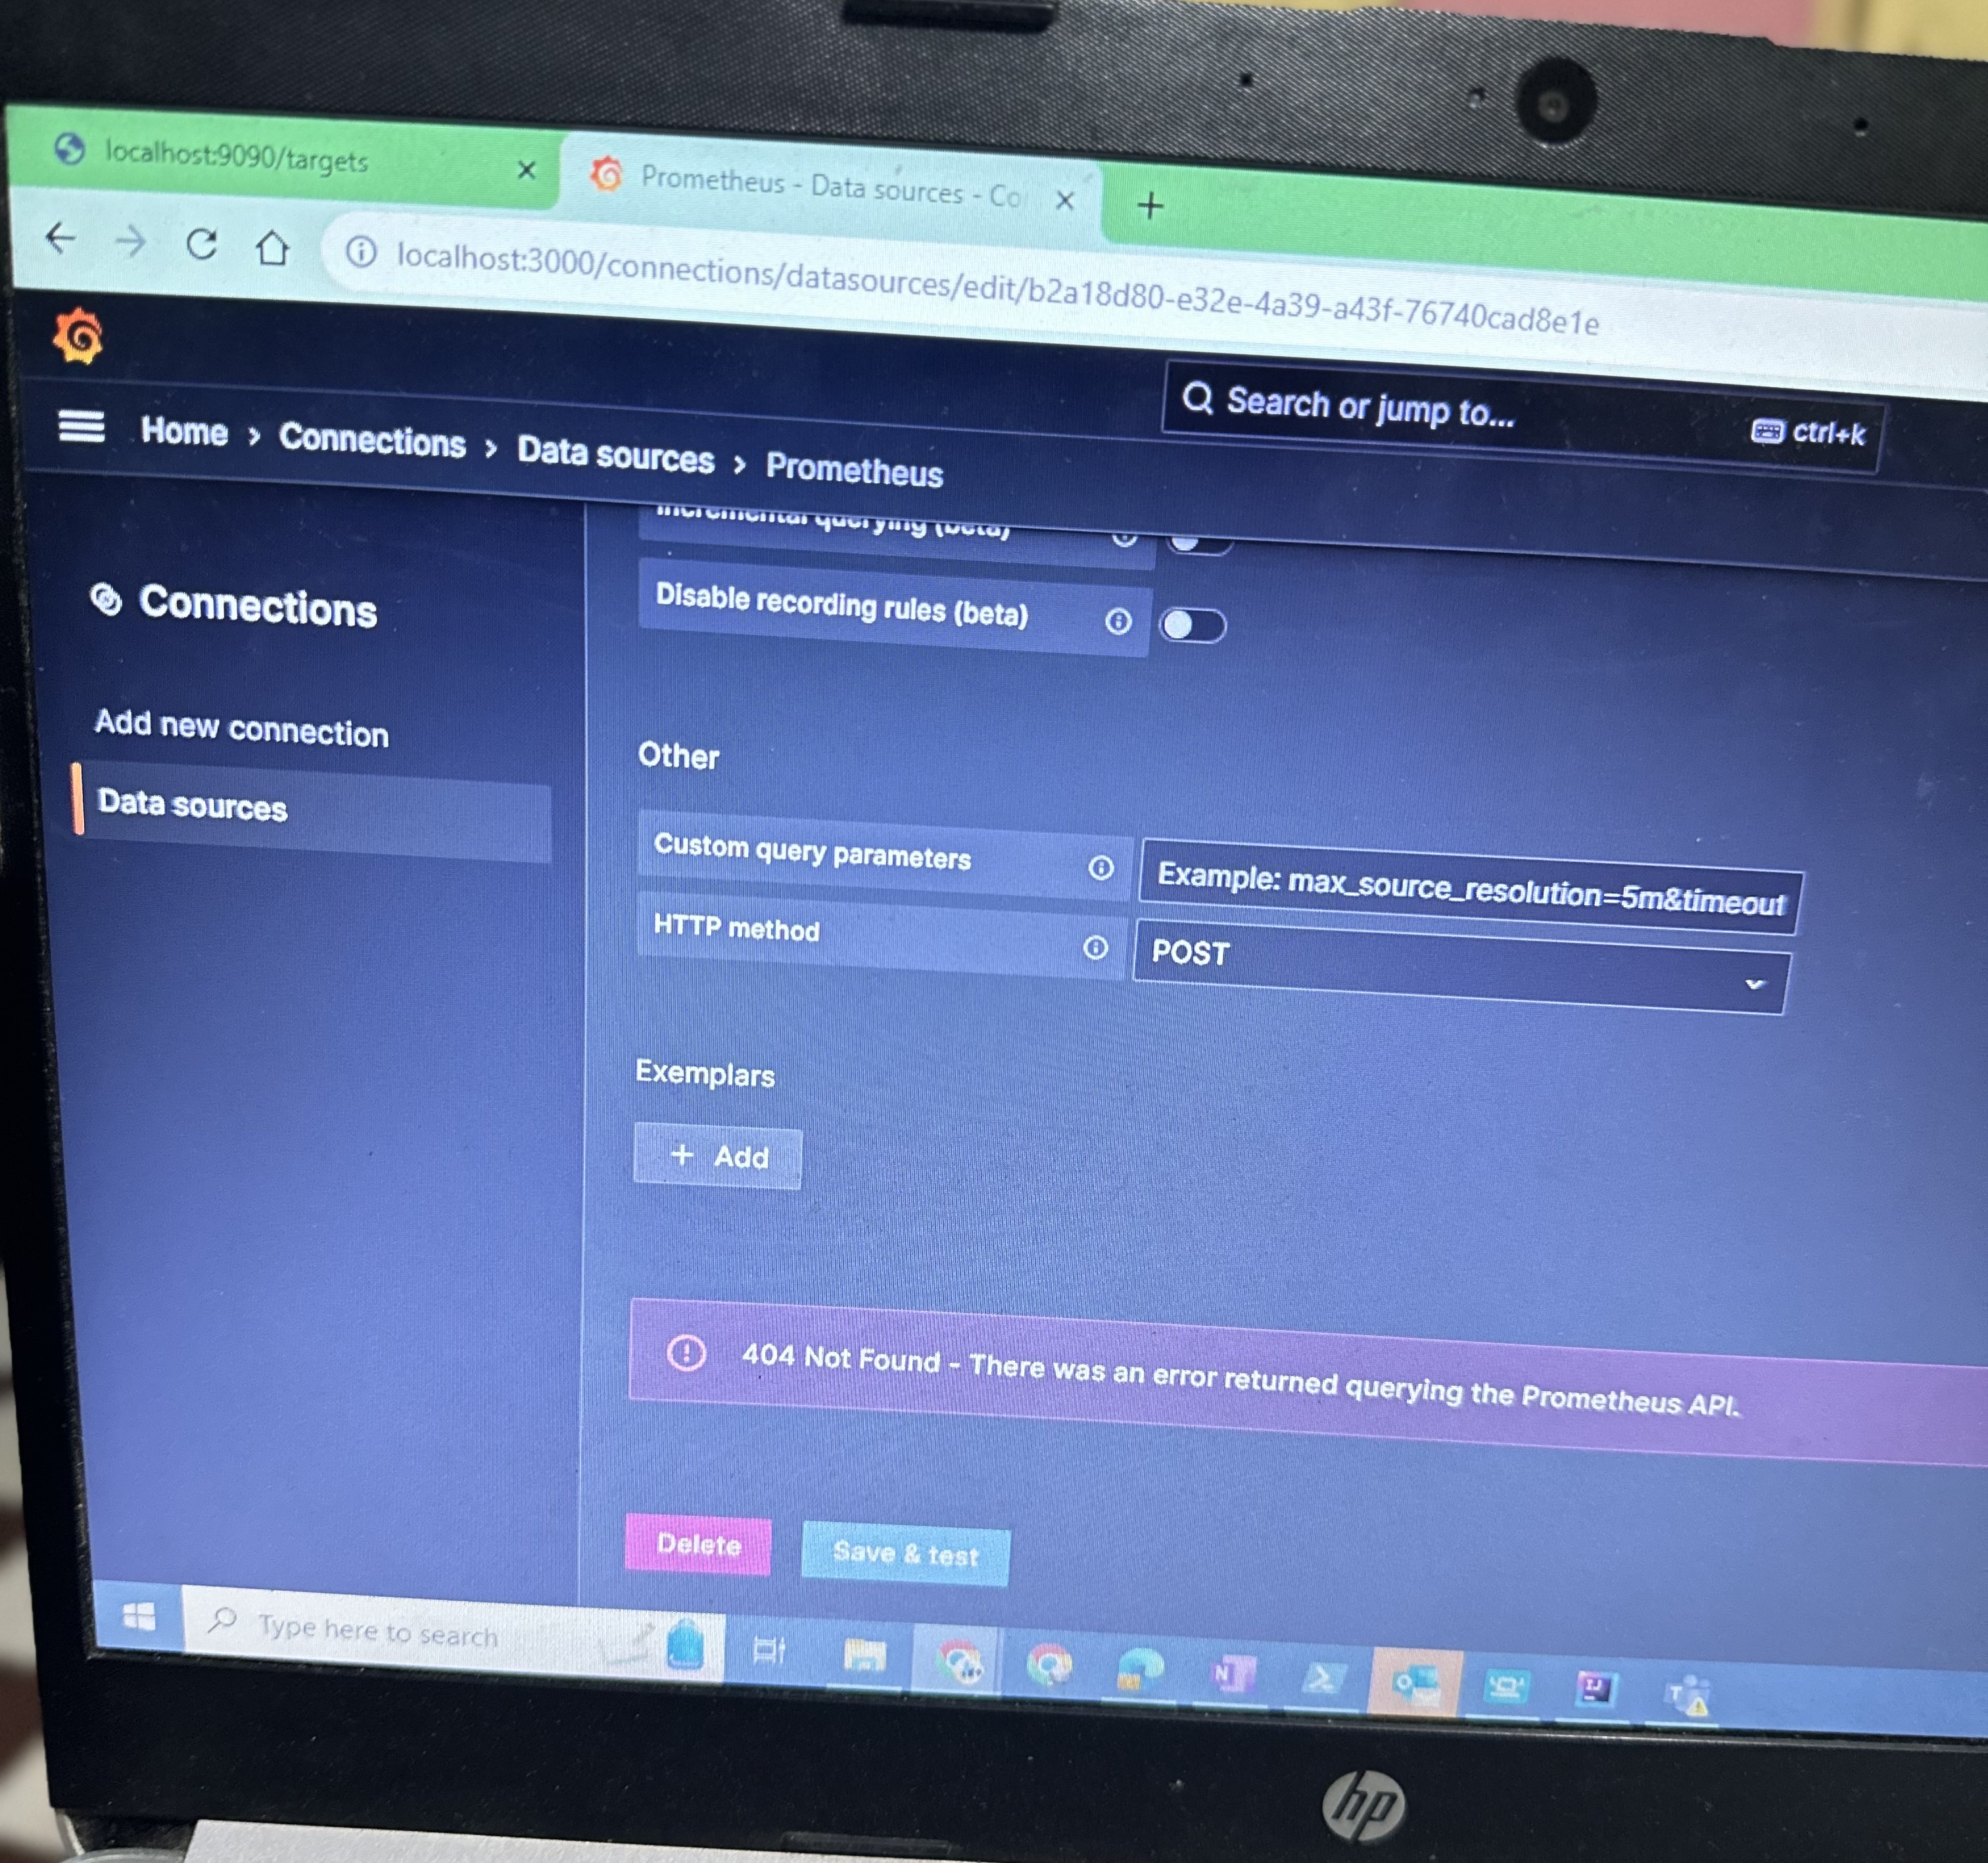
And when I am trying to add Prometheus as data source in Grafana using:
“http://pod_name:9090”—-> but this is giving 404 error.
I even tried adding Prometheus as data source using below in grafana: “htttp://pod_name:9099/metrics”—> This also is giving 404 error.
Please help me, how can i add Prometheus as data source in grafana to visualise the metrics.
Attached are some images for reference.
Hey @deepaksharma25047, you are trying to enter address of a pod where metrics are exposed in prometheus compatible format.
What grafana datasource of type prometheus need is a prometheus server endpoint.
So, what you need to do is :
- Either enter the svc / pod name of Prometheus server ( if you already have that’s scraping your OTEL pod)
- Install and configure a prometheus server that’s going to scrape your pod for the OTEL metrics and then specify that address in the grafana datasource.
Also, its giving 404 because grafana expects the path : /api/v1/query which is available only at prometheus server.