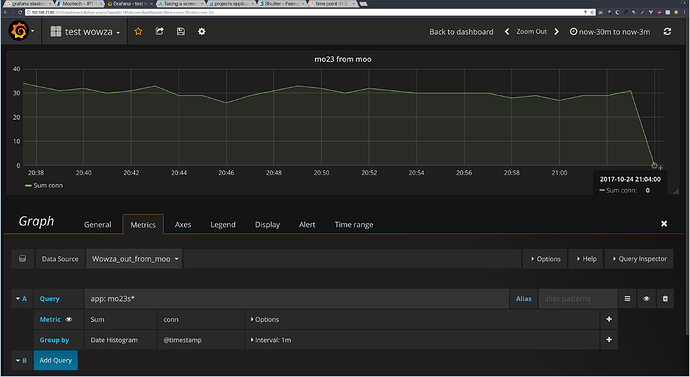
we found the data on the graph fall to zero frequently at last minute, refer to below image.
we basically use two kinds of metric collecting:
1.collectd collect devices snmp, and centralize them to logstash, then to elasticsearch. (interval: 30s)
2.logstash http_poller plugin to collect several of our apis metric. (interval: 60s)
both of the graph have the same thing happen, even in single stat panel (show 0).
we build this for out OPS team to replace PRTG for monitor near real time statistic, we’ll know something went wrong once the metric falls to zero.
first we thought, maybe the X-Axis just go beyond the data collection, so the data just need some time to get collected (logstash/colectd not yet trigger), fair enough.
since collect metric takes time, so it’s okey with us to add some timeshift (eg. now-1h to now-1m) to avoid this confusing, frequently happening falling graph.
BUT, IT JUST HAPPENENED, please refer to the image, such time point (21:04) should have value, doesn’t it?
we are greatly wondering what is going on and how can we avoid that?
let us know if we can provide other helpful information, msearch request/response, raw data…
many thanks.

