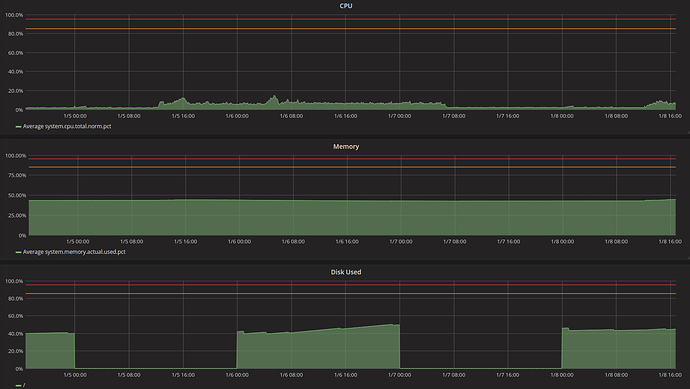
Data Missing Past Midnight (ES Data Source)

Hi all,

Very new to Grafana, but enjoying it’s advantages over Kibana already!

I created a table yesterday to tell me disk usage on ext4 file systems for a host, as selected by a $host variable. This morning, all the file system usage stats are 0% for all the machines in my cluster. I’ve found that past midnight (precisely), I’m getting values of 0 back from ES; however, running a similar query in Kibana is showing the values I would expect to see.

I had suspicions about the index patterns (indexes are daily), but they seem to line up in the JSON. To make matters even stranger, the CPU information that is coming from the same indexes is unaffected!

Any ideas?

Thanks,
Chris.

Tech stuff…
Grafana v4.6.3 (commit: 7a06a47) running on Centos 7.3

Elastic:

{
“name” : “v2qbguT”,
“cluster_name” : “stgmonitoring”,
“cluster_uuid” : “FY1onRioS26mFsqBSrp4wg”,
“version” : {
“number” : “6.1.0”,
“build_hash” : “c0c1ba0”,
“build_date” : “2017-12-12T12:32:54.550Z”,
“build_snapshot” : false,
“lucene_version” : “7.1.0”,
“minimum_wire_compatibility_version” : “5.6.0”,
“minimum_index_compatibility_version” : “5.0.0”
},
“tagline” : “You Know, for Search”
}

JSON request and response, as given by the query inspector, showing expected value just before midnight and the change to exactly 0 afterwards.

{
“xhrStatus”: “complete”,
“request”: {
“method”: “POST”,
“url”: “api/datasources/proxy/1/_msearch”,
“data”: “{"search_type":"query_then_fetch","ignore_unavailable":true,"index":["metricbeat-2017.12.20","metricbeat-2017.12.21"]}\n{"size":0,"query":{"bool":{"filter":[{"range":{"@timestamp":{"gte":"1513814310000","lte":"1513814430000","format":"epoch_millis"}}},{"query_string":{"analyze_wildcard":true,"query":"host: stgkafka01 AND system.filesystem.type: ext4"}}]}},"aggs":{"3":{"terms":{"field":"system.filesystem.mount_point.keyword","size":10,"order":{"_term":"desc"},"min_doc_count":1},"aggs":{"2":{"date_histogram":{"interval":"1m","field":"@timestamp","min_doc_count":1,"extended_bounds":{"min":"1513814310000","max":"1513814430000"},"format":"epoch_millis"},"aggs":{"1":{"avg":{"field":"system.filesystem.used.pct"}}}}}}}}\n”
},
“response”: {
“responses”: [
{
“took”: 11,
“timed_out”: false,
“_shards”: {
“total”: 10,
“successful”: 10,
“skipped”: 0,
“failed”: 0
},
“hits”: {
“total”: 4,
“max_score”: 0,
“hits”:
},
“aggregations”: {
“3”: {
“doc_count_error_upper_bound”: 0,
“sum_other_doc_count”: 0,
“buckets”: [
{
“2”: {
“buckets”: [
{
“1”: {
“value”: 0.020999999716877937
},
“key_as_string”: “1513814340000”,
“key”: 1513814340000,
“doc_count”: 1
},
{
“1”: {
“value”: 0
},
“key_as_string”: “1513814400000”,
“key”: 1513814400000,
“doc_count”: 1
}
]
},
“key”: “/data”,
“doc_count”: 2
},
{
“2”: {
“buckets”: [
{
“1”: {
“value”: 0.09290000051259995
},
“key_as_string”: “1513814340000”,
“key”: 1513814340000,
“doc_count”: 1
},
{
“1”: {
“value”: 0
},
“key_as_string”: “1513814400000”,
“key”: 1513814400000,
“doc_count”: 1
}
]
},
“key”: “/”,
“doc_count”: 2
}
]
}
},
“status”: 200
}
]
}
}

It’s even possible to curl a doc out from ES directly and see a non-zero value that should aggregate to non-zero using average.

{
“_id”: “NwVqdmABrbvf57qXtT9e”,
“_index”: “metricbeat-2017.12.21”,
“_score”: 6.9077773,
“_source”: {
@timestamp”: “2017-12-21T00:13:11.910Z”,
@version”: “1”,
“beat”: {
“hostname”: “stgkafka01”,
“name”: “stgkafka01”,
“version”: “6.1.0”
},
“fields”: {
“env”: “staging”
},
“host”: “stgkafka01”,
“index-group”: “metricbeat”,
“metricset”: {
“module”: “system”,
“name”: “filesystem”,
“rtt”: 1015
},
“system”: {
“filesystem”: {
“available”: 42005876736,
“device_name”: “/dev/nbd0”,
“files”: 3055616,
“free”: 44522651648,
“free_files”: 3020359,
“mount_point”: “/”,
“total”: 49080274944,
“type”: “ext4”,
“used”: {
“bytes”: 4557623296,
“pct”: 0.0929
}
}
},
“tags”: [
“u’Kafka’”,
“beats_input_raw_event”
]
},
“_type”: “doc”
}

Hi,

If you query elastic manually (curl) using the epoch timestamps from your request:
{“gte”:“1513814310000”,“lte”:“1513814430000”}

Do you get out the documents you expect to be used for calculation of the average of system.filesystem.used.pct? If not, I got the feeling that there may be some timezone issue somewhere. What timezone do you have on elastic cluster and grafana machine?

Marcus

Hi Marcus,

Yes, when I curled documents from the index yesterday, they returned with non zero values in the right fields for my metric.

In the course of scripting for installing ES on my monitoring machines, I did delete the indexes. Now the issue seems to have stopped, and didn’t appear again today at the turn of midnight. If it happens again I’ll certainly investigate time zones though.

Thanks!
Chris.

Cool. Just let me know if there would be any other problems.

Have a nice holiday

Marcus

Hi Marcus,

The problem has come up again. I haven’t used curl directly on elastic, but I can show you two documents spanning midnight (and the change in index) that both have the correct values.

When grafana queries for documents from today, the aggregation for system.filesystem.used.pct comes back as 0 (the graph shows the change at midnight).

Both machines are on UTC, to within 5s of each other, is there a timezone in the applications themselves that also needs setting?

I have also just looked back at data from over my holiday break and seen that on the 27th of December, all the disk usage values are 0%; again the documents in Kibana are non-zero and the issue in Grafana seemed to fix itself the next day.

Thanks,
Chris.

Just to clarify. You should have UTC timezone on your elasticsearch search cluster and on your grafana instance.

What kind of time ranges are you using in Grafana, only “Today” or “Today so far”? If you look over a time range of several days, does the same problem occur?

You can also try different timezone settings in the dashboard settings, they’re however only applicable to the browser.

Marcus

Hi Marcus,

Thanks for getting back to me again.

Yes, all machines in the ES cluster and the Grafana instance are on UTC.

The problem occurs regardless of time span. In the images below you can see the gaps from Friday and Sunday where the disk usage was aggregated as 0%, and a close up from one of those periods with the graph also at 0%.

It feels like too much of a coincidence that the gaps directly correlate to specific daily indexes, but it’s very strange given that the non-zero CPU and memory stats (also visible in the images) are coming from the same indexes.

Let me know if you’d like some more info from the system.
Thanks,
Chris.

weekend

close up

Hi,

Yes this feels indeed strange. Would it be possible to include a screenshot of the metric tab of the Disk used panel. You say that it’s displays correctly in kibana, would it be possible to include a screenshot of kibana visualization and metric/query definition?

Marcus

Hi Marcus,

I had not previously made a visualisation in Kibana for this metric, but had assumed it would work; considering the documents spanning midnight have the right information.

As it turns out, Kibana does the same thing! I think I’ll go and ask in the Elasticsearch community too, because it’s looking less and less like a Grafana issue.

Thanks,
Chris.

Hi,

Good that you found that. Yeah go ask in the elasticsearch community and please come back here if you find the solution and/or finds that it actually are a Grafana problem.

Good luck

Marcus

I had the same issue with my visualizations in Grafana. But in my case, the graphs in Kibana were correct. The Index name was [metricbeat-6.1.1-]YYYY.MM.DD and Pattern was Daily.

Changing Index name to metricbeat-* and Pattern to No pattern fixed the issue in Grafana.

Thanks silentghost. The indexes have since been rolled over to make space (it is currently a staging system), but when the issue comes up again then I’ll give your fix a go!

Chris.

Hello,

I have a similar issue. So I made a dashboard that’s visualising perfmon diskio metrics gathered by Metricbeat. I created a template hostname with value: {"find": "terms", "field": "beat.hostname"}

The weird thing is that when I select ‘All’ hosts in my template, I have some of the hosts which only show partial data. The data always seems to start or stop at midnight.

When I select only 1 of the hosts that is not showing data in the hostname dropdown box, it’s showing me all the data… Doublechecked the data in KIbana and it’s definitely there.

I tried silentghost’s suggestion and changed the datasource setting to metricbeat-* with Pattern Daily, but the issue persists. I’m on Grafana 5.1.4.

Any suggestion to help me fix this is welcome.

Grtz

Willem

Please use the query inspector to troubleshoot query issues and verify what kind of data is returned for the problematic host.

Marcus