Hello,
I started using Elasticsearch few weeks ago, and I’m now trying to connect it with Grafana, to plot some data I have.
In particular, if I query Elasticsearch, using:
127.0.0.1:9200/indexname/_search
My data looks correct:
{“took”:3,“timed_out”:false,“_shards”:{“total”:1,“successful”:1,“skipped”:0,“failed”:0},“hits”:{“total”:{“value”:4,“relation”:“eq”},“max_score”:1.0,“hits”:[{“_index”:“XXX”,“_id”:“7ERPqoIBqpRLjSlgvXVC”,“_score”:1.0,“_source”:{
“timestamp”:“5623734345000”,
“UserType”: “ios”,
“UserId”: “8”,
“Location”: “Chennai”,
“Data”: {
“Source”:“LoginScreen”,
“VideoLoadDuration”: “100”,
“TimeSpend” : “12”,
“BytesStreamed” : “200”,
“FullVideoPlayed” : “true”,
“MetaPageVisited” : “true”,
“TimeSpentOnMetaPage” : “5”,
“TimeSpentOnChat” : “2”
}}
},{“_index”:“mobilehacks”,“_id”:“7URRqoIBqpRLjSlgg3Vc”,“_score”:1.0,“_source”:{
“timestamp”:“5623734345000”,
“UserType”: “android”,
“UserId”: “5”,
“Location”: “Chennai”,
“Data”: {
“Source”:“LoginScreen”,
“VideoLoadDuration”: “100”,
“TimeSpend” : “12”,
“BytesStreamed” : “200”,
“FullVideoPlayed” : “true”,
“MetaPageVisited” : “true”,
“TimeSpentOnMetaPage” : “5”,
“TimeSpentOnChat” : “2”
}}
},{“_index”:“mobilehacks”,“_id”:“7kSQqoIBqpRLjSlg2XVX”,“_score”:1.0,“_source”:{
“timestamp”:“2022-08-17”,
“UserType”: “android”,
“UserId”: “5”,
“Location”: “Chennai”,
“Data”: {
“Source”:“LoginScreen”,
“VideoLoadDuration”: “100”,
“TimeSpend” : “12”,
“BytesStreamed” : “200”,
“FullVideoPlayed” : “true”,
“MetaPageVisited” : “true”,
“TimeSpentOnMetaPage” : “5”,
“TimeSpentOnChat” : “2”
}}
},{“_index”:“mobilehacks”,“_id”:“70SSqoIBqpRLjSlgHHXi”,“_score”:1.0,“_source”:{
“timestamp”:“2022-08-17”,
“UserType”: “ios”,
“UserId”: “6”,
“Location”: “Dubai”,
“Data”: {
“Source”:“LoginScreen”,
“VideoLoadDuration”: “100”,
“TimeSpend” : “12”,
“BytesStreamed” : “200”,
“FullVideoPlayed” : “true”,
“MetaPageVisited” : “true”,
“TimeSpentOnMetaPage” : “5”,
“TimeSpentOnChat” : “2”
}}
}]}}
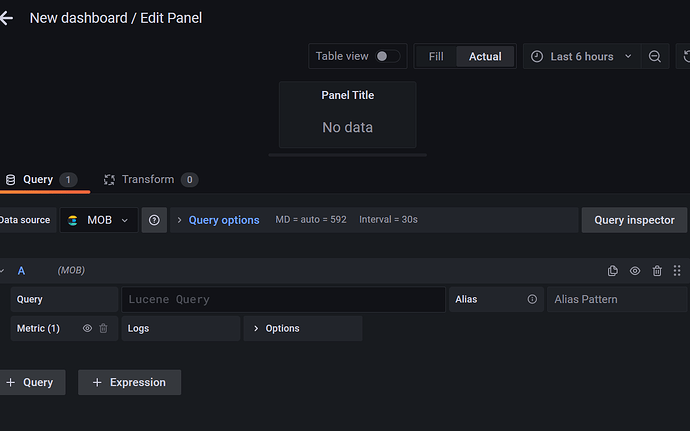
I am trying the view the data in dashboard using the below query but i am getting no data
When I “Save & Test” the elastic data source, everything is fine and I get the message:
Index OK. Time field name OK.
I am using elastic version:“version” : {
“number” : “8.3.3”,
I got the below response from query inspector
{
“request”: {
“url”: “api/datasources/proxy/3/_msearch?max_concurrent_shard_requests=5”,
“method”: “POST”,
“data”: “{"search_type":"query_then_fetch","ignore_unavailable":true,"index":"mobilehacks"}\n{"size":500,"query":{"bool":{"filter":[{"range":{"timestamp":{"gte":1660697565184,"lte":1660719165184,"format":"epoch_millis"}}}]}},"sort":[{"timestamp":{"order":"desc","unmapped_type":"boolean"}},{"_doc":{"order":"desc"}}],"script_fields":{},"aggs":{"1":{"date_histogram":{"field":"timestamp","min_doc_count":0,"extended_bounds":{"min":1660697565184,"max":1660719165184},"format":"epoch_millis","fixed_interval":"30s"},"aggs":{}}},"highlight":{"fields":{"*":{}},"pre_tags":["@HIGHLIGHT@"],"post_tags":["@/HIGHLIGHT@"],"fragment_size":2147483647}}\n”,
“hideFromInspector”: false
},
“response”: {
“took”: 32,
“responses”: [
{
“took”: 32,
“timed_out”: false,
“_shards”: {
“total”: 1,
“successful”: 1,
“skipped”: 0,
“failed”: 0
},
“hits”: {
“total”: {
“value”: 0,
“relation”: “eq”
},
“max_score”: null,
“hits”:
},
“aggregations”: {
“1”: {
“buckets”: [
{
“key_as_string”: “1660697550000”,
“key”: 1660697550000,
“doc_count”: 0
},
{
“key_as_string”: “1660697580000”,
“key”: 1660697580000,
“doc_count”: 0
},
…
Can anyone figure out whether is issue with query or with the connection
