Hello everyone,
The following scenario:
I am collecting various devices of the same type. The collected values, e.g. temperature, are always the same. I would now like to display them in a table for each device. This works so far, but the values are not displayed one below the other, but a new column with the same name is created for each device (see attached image). How can I get the values to be displayed one below the other in a common column?
Grafana Version 10.2.0 on Ubuntu.
Table:

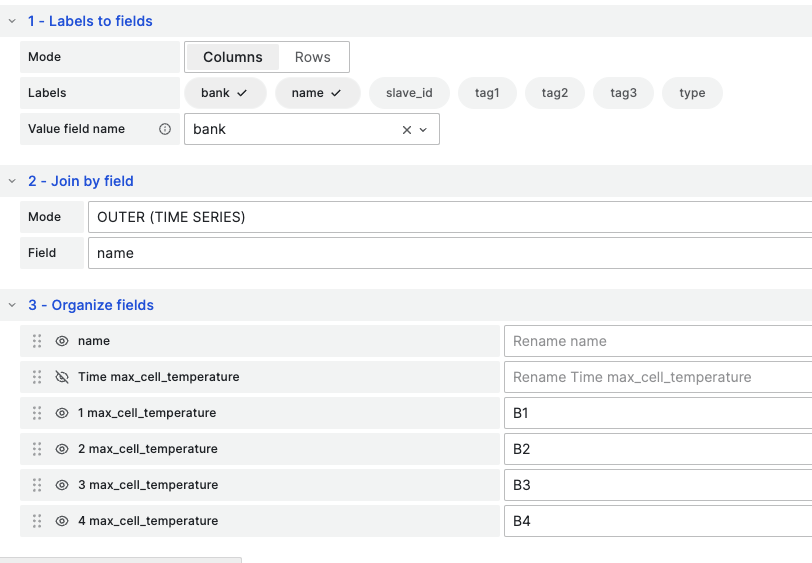
Transformations:
Example-Query for Device1:
from(bucket: “bucket”)
|> range(start: v.timeRangeStart, stop: v.timeRangeStop)
|> filter(fn: (r) => r[“_measurement”] == “temp”)
|> filter(fn: (r) => r[“_field”] == “banktotal”)
|> filter(fn: (r) => r[“name”] == “els-bms-1”)
|> filter(fn: (r) => r[“bank”] == “1” or r[“bank”] == “2” or r[“bank”] == “3” or r[“bank”] == “4”)
|> aggregateWindow(every: v.windowPeriod, fn: last, createEmpty: false)
|> last()
Thanks in advance!
