I’m currently graphing number of test-failures. I firstly made several graphs for several verdicts, and here I could hover over a point, and it would show me the value;
But when I made it only to one graph, the points no longer show information; any ideas?
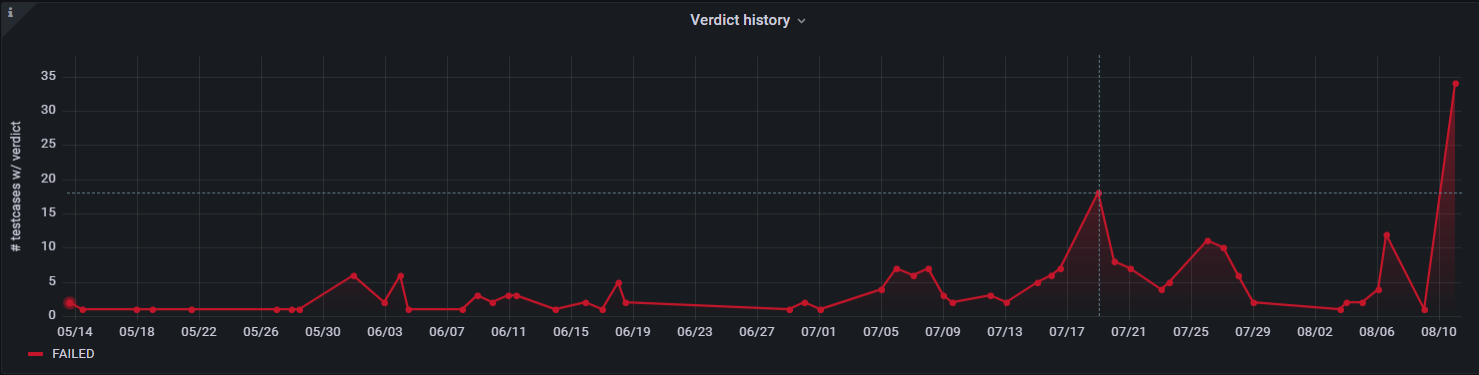
For one graph my hover is working…
what is your grafana version ?
can you show us data format and panel option ?
did you try apply and reload the page ?
Did you know you can make a multiple line graph a still display one of the by clicking on his legend. You can even filter by multiple line holding control key + click legend.
Where do I see what version of grafana is running?
you can see it bottom left of your grafana page, on your profile icon somewhere 
I’m currently using version * Grafana v8.1.1 (90c87a52f7)