We encountered a visual bug for data points that is causing some confusion to other internal users so may I know if you would be able to assist me regarding the issue below? Thank you.
Grafana Version: 8.5.13
Data source: Oracle Cloud Infrastructure Metrics
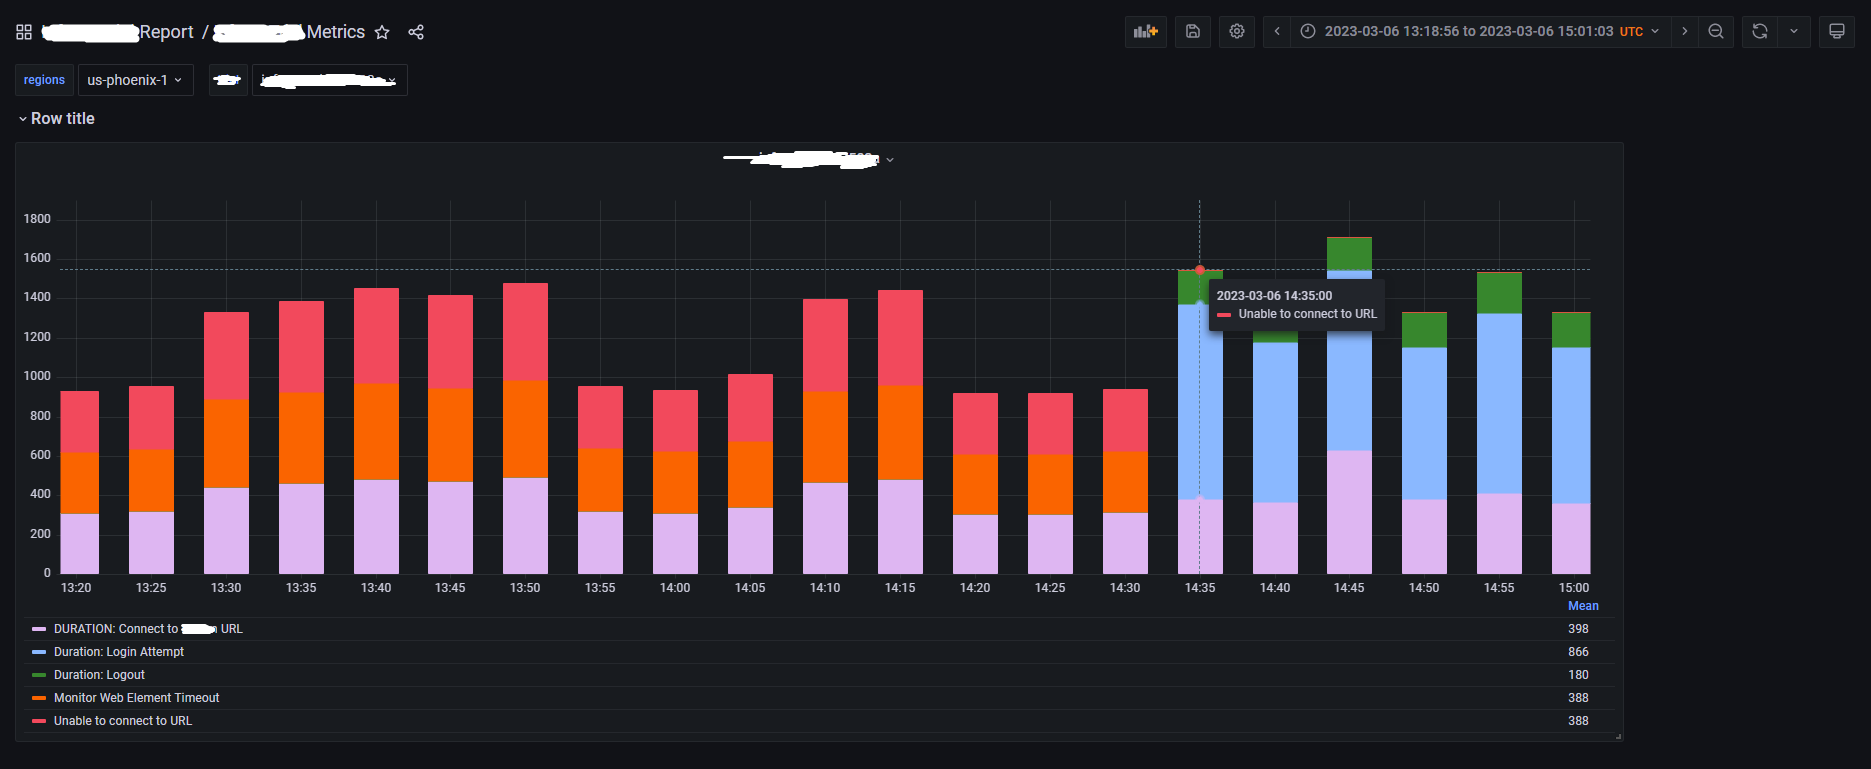
If you check the screenshot below. The bar graph on 14:35 timestamp shows that “Unable to connect to URL” is present
but after clicking the same legend to make the graph show only that, 14:35 timestamp now shows that it doesn’t have it.
Hi @jrenriqu,
Welcome to the  community support forums !!
We are excited that you joined our OSS community. Please read about some of the FAQs in the community 
Please review the submission template and include more details:
- Is the only reproducible while using the Bar chart visualization panel OR also happen with other panels?
- Could you please try to reproduce this issue on your machine if you can update it to the latest version of Grafana 9.4.x? (does it still occur after the update)?
- What happened?
- Is it possible for you to reproduce this same issue on https://play.grafana.org/ and then share the dashboard link so that we can view it?
Thanks