Kubernetes App for Grafana :: Not able to connect to DS

I am trying to use the Kubernetes App in Grafana (kubernetes plugin for Grafana | Grafana Labs)

I am entering the information for my K8S cluster. The API / K8S master node is the one that I am trying to use.

29850839-666f54a2-8cfe-11e7-907d-0cdb8d584a7f

But when I click on Deploy , I get “Could not connect to cluster”

When I try to manually add K8S as my DataSource, I get “Unknown” Error.

Does anyone know what this “Unknown Error” might be ?

Try changing your access mode to “proxy” unless you have really good reasons for using “direct”. To see the actual error, check the Chrome Dev Tools (it is a bug in the K8s App that it does not give a better error).

1 Like

Thanks daniellee.

The reason I selected “Direct Access” was that its the URL that I can access directly via browser. So I opened Chrome Dev tools and checked the Response I get. See screenshot below :slight_smile:

Although I URL (http://172.29.219.65:8080) is my K8S Matser and it is returning all the API results but I am still getting the “Unknown error”.

The Header values are :

Request URL:http://172.29.219.65:8080/
Request Method:GET
Status Code:200 OK
Remote Address:172.29.219.65:8080
Referrer Policy:no-referrer-when-downgrade

Looking into the Console output, I do see the Error :

XMLHttpRequest cannot load http://172.29.219.65:8080/. No 'Access-Control-Allow-Origin' header is present on the requested resource. Origin 'http://172.29.219.97:30998' is therefore not allowed access.

Proxy mode exists to prevent CORS (Cross Origin) errors which you can get if you access directly from your browser. That’s why it is the default. Direct access is only used in special circumstances (local authentication through Active Directory/LDAP for example).

1 Like

Got it. Thanks daniellee. I switched to Proxy mode and now get :

GET http://172.29.219.97:30998/api/datasources/proxy/5/ 403 (Forbidden)

172.29.219.97:30998 is the IP:Port of my grafana server.

More details say :

The following error was encountered while trying to retrieve the URL: http://172.29.219.65:8080/

Access Denied.

Access control configuration prevents your request from being allowed at this time. Please contact your service provider if you feel this is incorrect.

172.29.219.65:8080 is the IP:Port of my K8S Master.

I believe there might be some limiting factor on my corporate network. I’ll contact the network admin and question this.

Is it a problem with authentication? Usually you would authenticate with TLS certs:

image

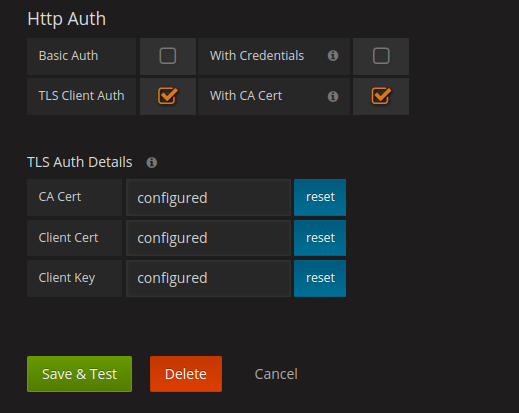
I setup Client Certs & Client Key using

openssl req -nodes -new -x509 -keyout clientkey.pem -out clientreq.pem -days 365

Even tried to generate CA cert and use it but did not work.

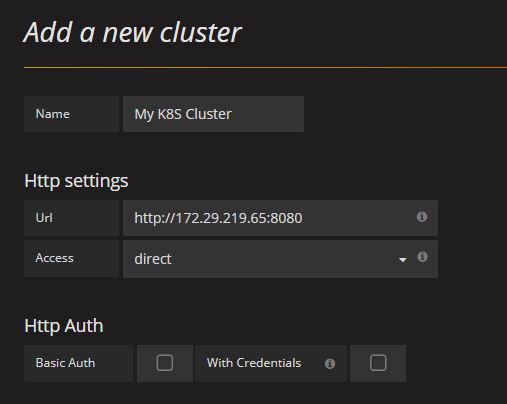
Whats weird is that if I try to access the URL “http://172.29.219.65:8080/” directly, I can do it :

No idea why I cant upload any pictures anymore :confused: Here is the curl output.

# curl http://172.29.219.65:8080/
{
  "paths": [
    "/api",
    "/api/v1",
    "/apis",
    "/apis/apps",
    "/apis/apps/v1beta1",
    "/apis/authentication.k8s.io",
    "/apis/authentication.k8s.io/v1beta1",
    "/apis/authorization.k8s.io",
    "/apis/authorization.k8s.io/v1beta1",
    "/apis/autoscaling",
    "/apis/autoscaling/v1",
    "/apis/batch",
    "/apis/batch/v1",
    "/apis/batch/v2alpha1",
    "/apis/certificates.k8s.io",
    "/apis/certificates.k8s.io/v1alpha1",
    "/apis/extensions",
    "/apis/extensions/v1beta1",
    "/apis/policy",
    "/apis/policy/v1beta1",
    "/apis/rbac.authorization.k8s.io",
    "/apis/rbac.authorization.k8s.io/v1alpha1",
    "/apis/storage.k8s.io",
    "/apis/storage.k8s.io/v1beta1",
    "/healthz",
    "/healthz/ping",
    "/healthz/poststarthook/bootstrap-controller",
    "/healthz/poststarthook/extensions/third-party-resources",
    "/healthz/poststarthook/rbac/bootstrap-roles",
    "/logs",
    "/metrics",
    "/swaggerapi/",
    "/ui/",
    "/version"
  ]
}

But the URL is not accessible from Grafana using the Proxy method :thinking::thinking::thinking:

Can you ping/curl the url from the machine where Grafana is installed?

So my grafana instance is containerized as a docker image and is deployed using Kubernetes. Below are the results from within the container/pod.

# kubectl get pod | grep grafana
grafana-deployment-2968758414-ffvd2                               1/1       Running            0          1d

# kubectl exec -it grafana-deployment-2968758414-ffvd2 -- /bin/bash
[root@grafana-deployment-2968758414-ffvd2 /]# 

[root@grafana-deployment-2968758414-ffvd2 /]# ping -c 1 172.29.219.65
PING 172.29.219.65 (172.29.219.65) 56(84) bytes of data.
64 bytes from 172.29.219.65: icmp_seq=1 ttl=63 time=0.176 ms

--- 172.29.219.65 ping statistics ---
1 packets transmitted, 1 received, 0% packet loss, time 0ms
rtt min/avg/max/mdev = 0.176/0.176/0.176/0.000 ms
[root@grafana-deployment-2968758414-ffvd2 /]#

[root@grafana-deployment-2968758414-ffvd2 /]# curl http://172.29.219.65:8080/
{
  "paths": [
    "/api",
    "/api/v1",
    "/apis",
    "/apis/apps",
    "/apis/apps/v1beta1",
    "/apis/authentication.k8s.io",
    "/apis/authentication.k8s.io/v1beta1",
    "/apis/authorization.k8s.io",
    "/apis/authorization.k8s.io/v1beta1",
    "/apis/autoscaling",
    "/apis/autoscaling/v1",
    "/apis/batch",
    "/apis/batch/v1",
    "/apis/batch/v2alpha1",
    "/apis/certificates.k8s.io",
    "/apis/certificates.k8s.io/v1alpha1",
    "/apis/extensions",
    "/apis/extensions/v1beta1",
    "/apis/policy",
    "/apis/policy/v1beta1",
    "/apis/rbac.authorization.k8s.io",
    "/apis/rbac.authorization.k8s.io/v1alpha1",
    "/apis/storage.k8s.io",
    "/apis/storage.k8s.io/v1beta1",
    "/healthz",
    "/healthz/ping",
    "/healthz/poststarthook/bootstrap-controller",
    "/healthz/poststarthook/extensions/third-party-resources",
    "/healthz/poststarthook/rbac/bootstrap-roles",
    "/logs",
    "/metrics",
    "/swaggerapi/",
    "/ui/",
    "/version"
  ]
}
1 Like

@daniellee I have similar problem with laates version. Doesn’t matter which combination of TLS or CA Auth I use, I always get same error on save:

deployments.apps is forbidden: User "system:anonymous" cannot list deployments.apps in the namespace "kube-system" 

I tried CA certs in:

  • local kube config
  • kubernetesdash board
  • tiller

seems like doesn’t matter which cert is used, grafa always try to use anonymous user.

In my case grafana is deployed using grafana helm, so it has access to local token for auth, will be great an option to use it

@jasl there are now two apps for k8s - one for Graphite (which is deprecated) and one for Prometheus. Which one are you using?

I’m having the same problem. I’m using the new grafana kubernetes app for prometheus.

@daniellee I’m using the one for Prometheus and I’m getting the same problem:

deployments.apps is forbidden: User “system:anonymous” cannot list deployments.apps in the namespace “kube-system”

@jasl @adrianosantos which version of Kubernetes are you using? Looks like a k8s permissions problem:

@daniellee I am on 1.8.4 on azure

I don’t know the answer to this problem - I have never used RBAC with Kubernetes.

But it looks like there is already an issue for adding a RBAC role to the app:

@jasl @danielle I notice the permission problem and I fixed it with
kubectl create clusterrolebinding grafana-admin-binding
–clusterrole=cluster-admin
–serviceaccount=:<ACCOUNT_NAME>

Connecting to the container with kubectl exec -it I’m able to execute and get the expected result for example to get the namespaces with the following curl:

curl -v --cacert /var/run/secrets/kubernetes.io/serviceaccount/ca.crt -H “Authorization: Bearer $(cat /var/run/secrets/kubernetes.io/serviceaccount/token)” https//kubernetes.default/api/v1/namespaces

But there is no place in the config page to enter the certificate and/or token when you choose direct connect.

My kubernetes version is 1.9+

$ kubectl version --short
Client Version: v1.9.2
Server Version: v1.9.1+2.0.2.el7

I’m able to get all deployments:
curl -v --cacert /var/run/secrets/kubernetes.io/serviceaccount/ca.crt -H “Authorization: Bearer $(cat /var/run/secrets/kubernetes.io/serviceaccount/token)” https//kubernetes.default/apis/extensions/v1beta1/deployments

@daniellee This is exactly the problem we are having. We are not able to pass from config page due to permissions. Our setup uses RBAC without Basic Auth and Grafana is installed with a service account by tiller. The dashboard is not honoring the service account when it tries to connect to the kubernetes.

Are you using Direct mode on the cluster config page in the app? Why? You should almost definitely be using proxy mode.

(Direct means directly from your browser and is usually used with single sign on or because you have your own proxy between Grafana and k8s that handles authentication/CORS headers)

@danillee Hi Daniel, the reason I was using direct connect is because when I try with proxy it was was not working. I reinstalled everything and I’m able to pass the config page using proxy. Thank you very much for your promptly response. Now when I go to the Dashboard it gives an error that “Datasource not found”. I checked the datasource in the list of datasources and it is there. Any clues?