I’m running a barchart visualization that always gives me an error (the plot is not defined) on the dashboard:
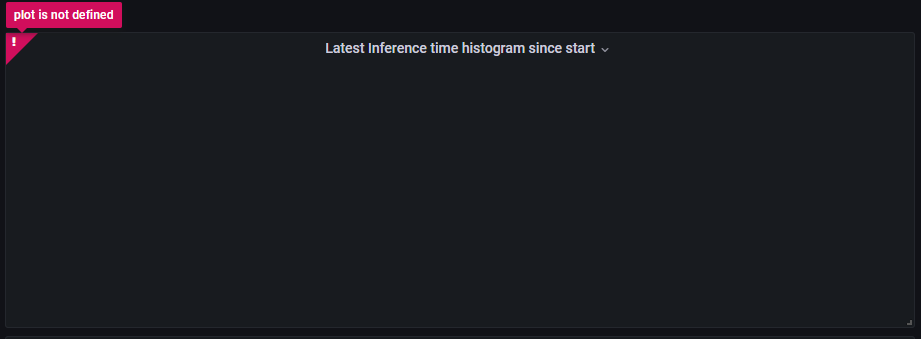
I see the same when I click on edit:
But when I switch from table view and back, the visualization works perfectly:
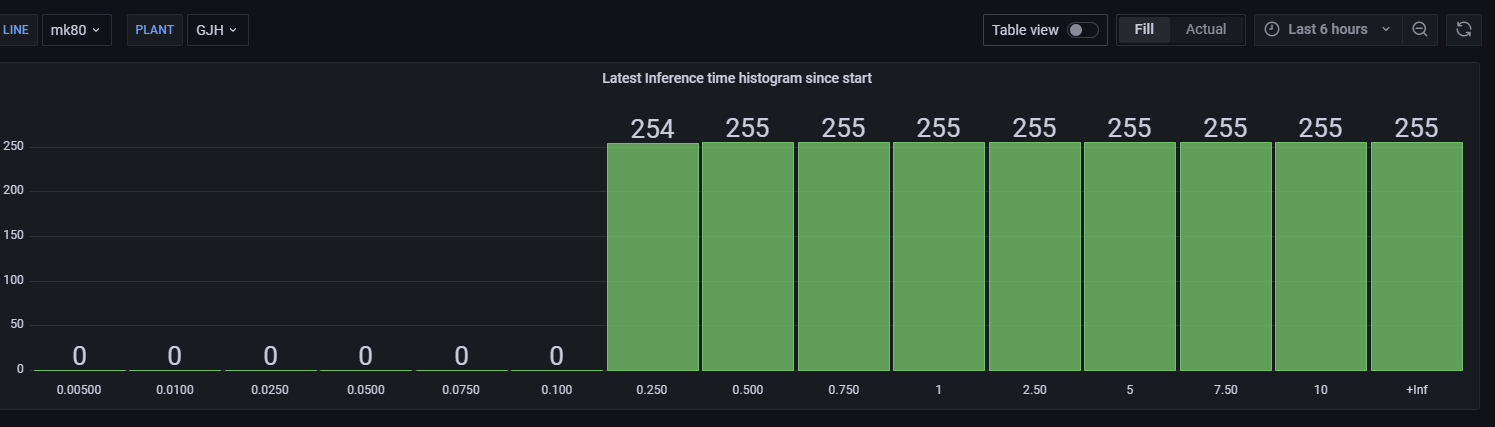
Is this a bug? How can I fix this? This is the query and data (which has no issues I believe):
InsightsMetrics
| where Name contains "inference_time_bucket"
| extend t = parse_json(Tags)
| where t.line == 'mk80' and t.plant contains 'gjh'
| where t.adapter contains 'inferencing'
| project TimeGenerated, Tags, tostring(t.le), Val
| summarize arg_max(TimeGenerated, *) by Tags
| extend t = parse_json(Tags)
| project tostring(t.le), Val
| render barchart
| 0.005 | 0 | ||
|---|---|---|---|
| 0.01 | 0 | ||
| 0.025 | 0 | ||
| 0.05 | 0 | ||
| 0.075 | 0 | ||
| 0.1 | 0 | ||
| 0.25 | 259 | ||
| 0.5 | 260 | ||
| 0.75 | 260 | ||
| 1.0 | 260 | ||
| 2.5 | 260 | ||
| 5.0 | 260 | ||
| 7.5 | 260 | ||
| 10.0 | 260 | ||
| +Inf | 260 |