I have an issue when I try to create a data source and then viewing the graphics associated with this datasource. I’m trying to create a Graphite database and I’m not using the port 8080 but the 8085 one.
Here’s a screenshot of my configs :
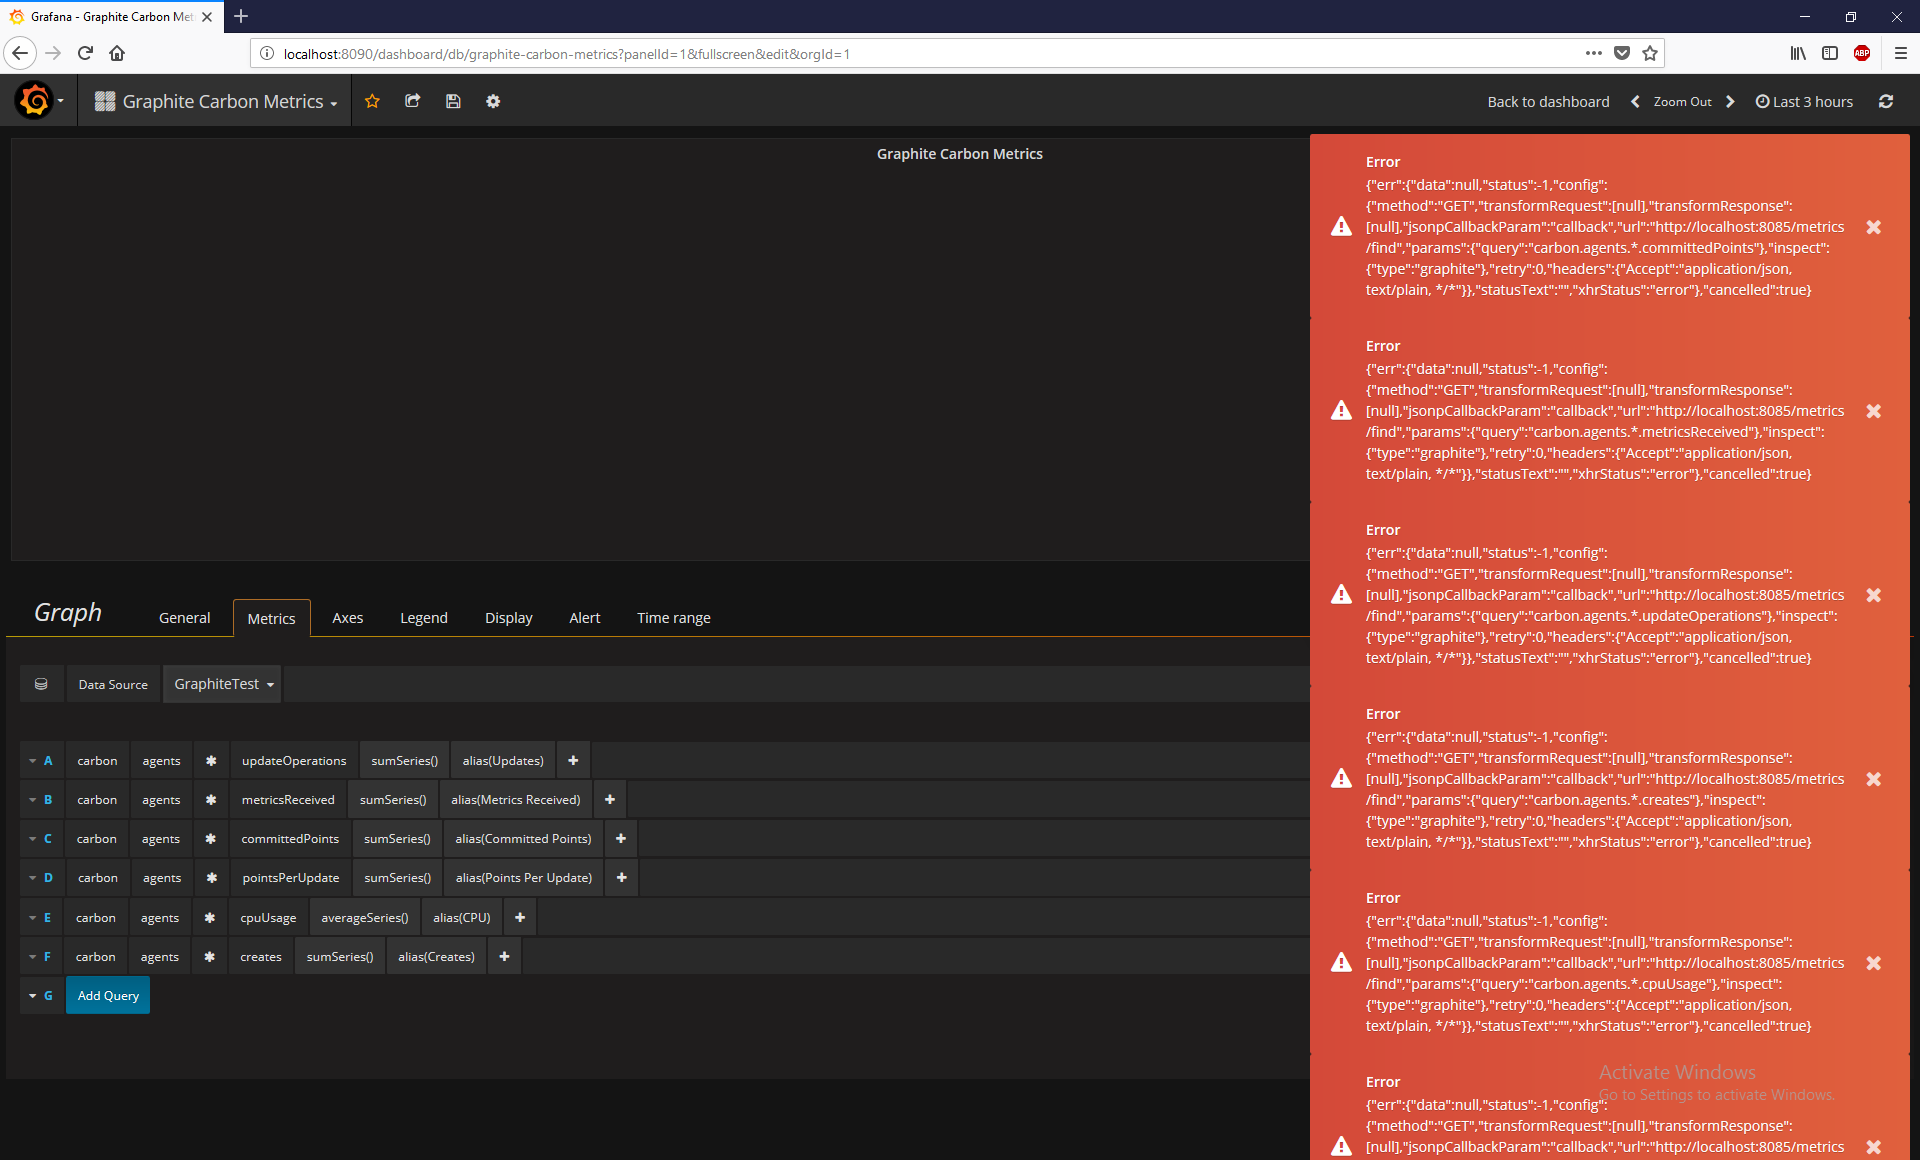
I get an empty red alert box which is hard for me to pin point the error code.
So when I’m about to choose my Graphite database and for instance I try to write “apps” into my query I get this error message :
I also configured my grafana localhost port at 8090 because I’m using 8080 for jenkins. I don’t if that can cause an issue. I appreciate any kind of help.
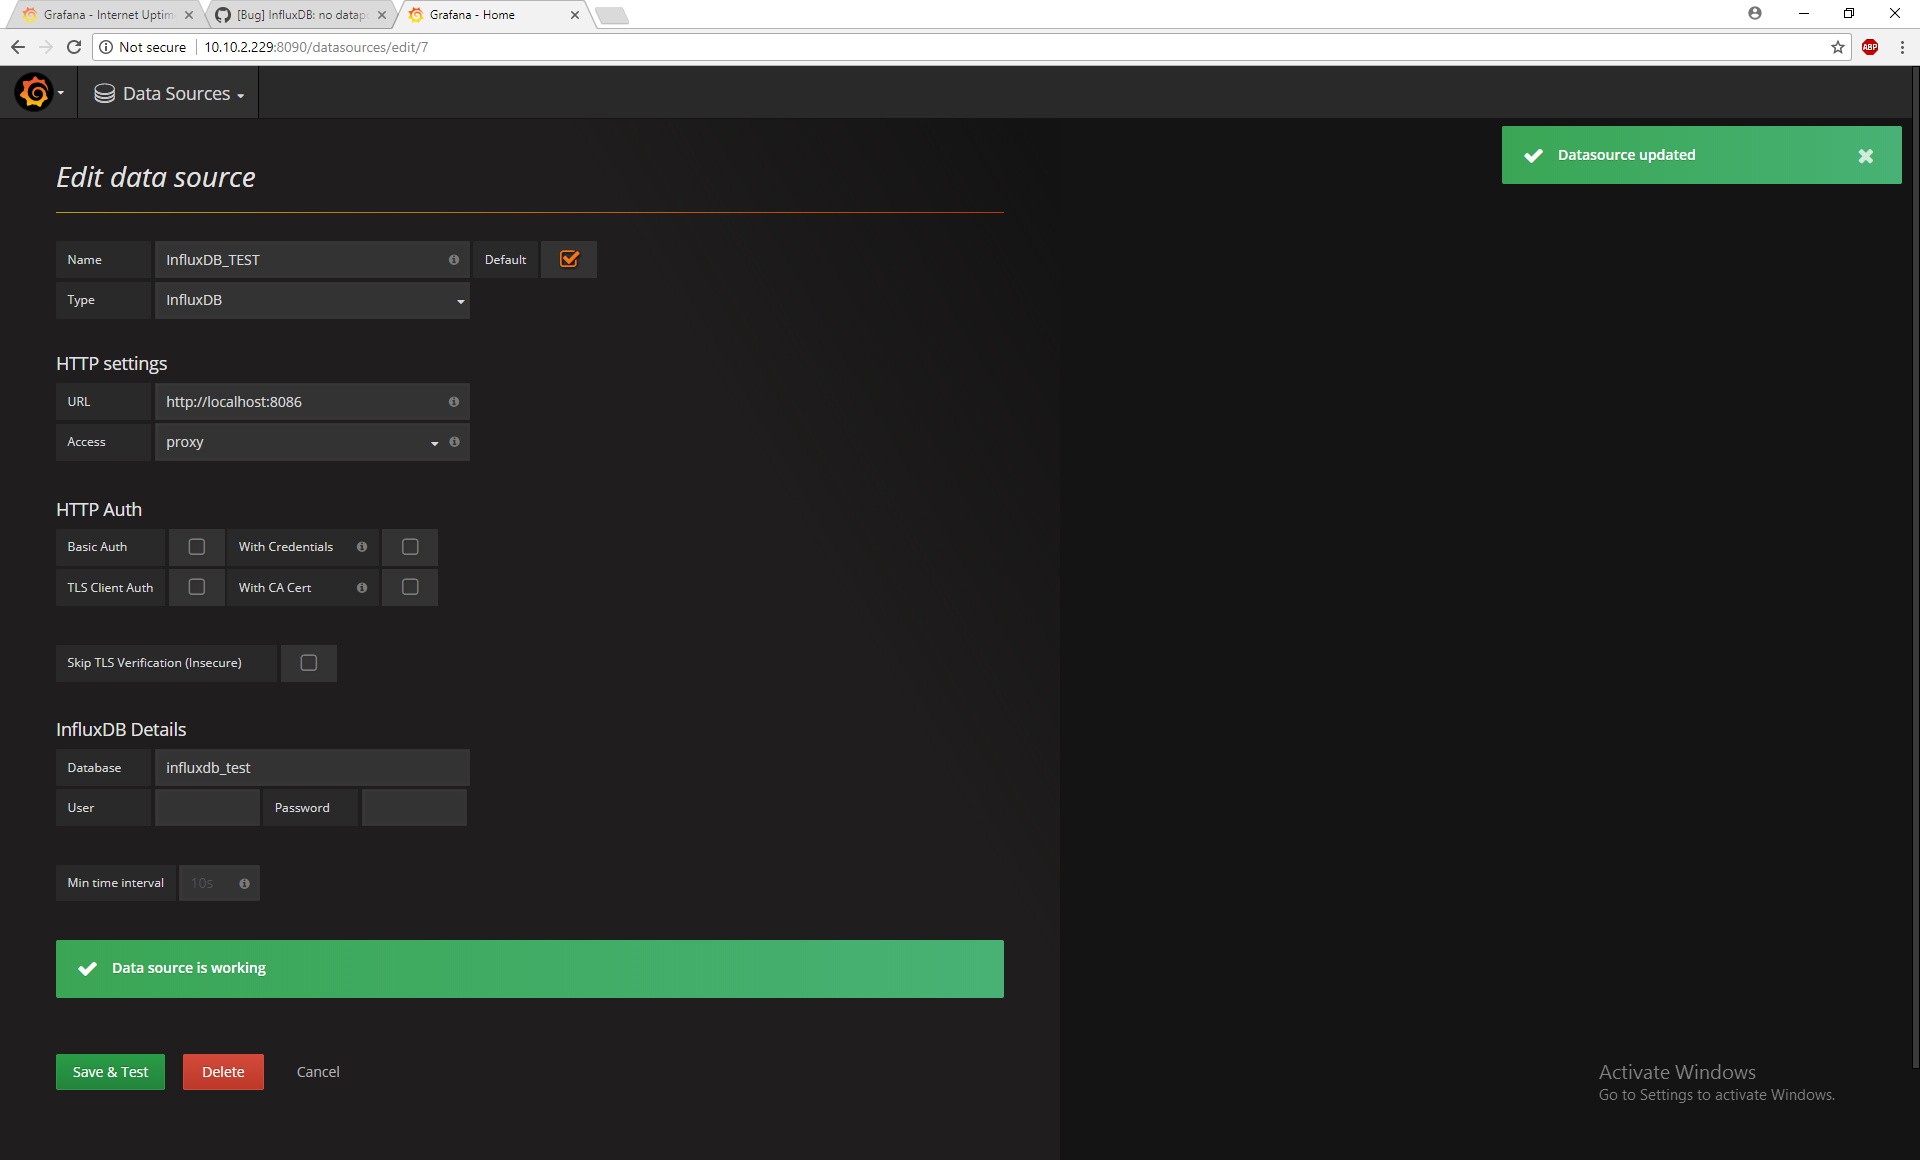
Any special reason for choosing Http Setting Access as Direct? You probably want proxy mode.
Direct means directly from your browser to the Graphite database. So you are probably getting a Cross Origin error (which is a security feature built into all modern browsers). Proxy mode adds the appropriate CORS headers.
The “Database table is locked” message is just a warning and Grafana automatically retries. This is a limitation of using Sqlite as the backend db. If you have lots of people saving dashboards then this could be a problem but then you will see errors and not just the warning. So this has nothing to do with your problem.
A 502 error means that the connection between Grafana and Graphite does not work.
Does the graphite url work? Can you access http://10.10.2.229:8080 from your machine and from the server? (you should come to the graphite browser page)
Thank you for clarifying everything. I have a better understanding now.
No the url dosen’t work. I’m not sure if it’s a firewall related issue because
I was running jenkins earlier on the port 8080 and everything was fine. Maybe
it’s not related?
On a side note, do I need to install graphite outside of grafana before using it?
I though that creating graphite within grafana was enough but maybe I missed
a step in the documentation.
In the video, I’ve noticed that the person is running his db as a service like grafana.
I’m not doing that with graphite, do I need to do the same? If so, I will look into it (also
the firewall).
So you never installed Graphite? Grafana and Graphite are totally separate products. Grafana is a visualization tool. Graphite is a database.
Native Graphite does not work on Windows so I was wondering how you managed to install it. From the Graphite docs
Unfortunately, native Graphite on Windows is completely unsupported, but you can run Graphite on Windows in Docker or the Installing via Synthesize article will help you set up a Vagrant VM that will run Graphite. In order to leverage this, you will need to install Vagrant.
You should probably look at either InfluxDB or Prometheus for your time series database if you want to monitor a Windows environment. Both work great with Grafana.
I’m missing all the data from the graph that I imported but it’s possible that
I’m missing some crucial steps.
I was wondering why I don’t have any data? I’ll keep looking in the meaning.
Thanks for all the help Daniellee, I appreciate it!
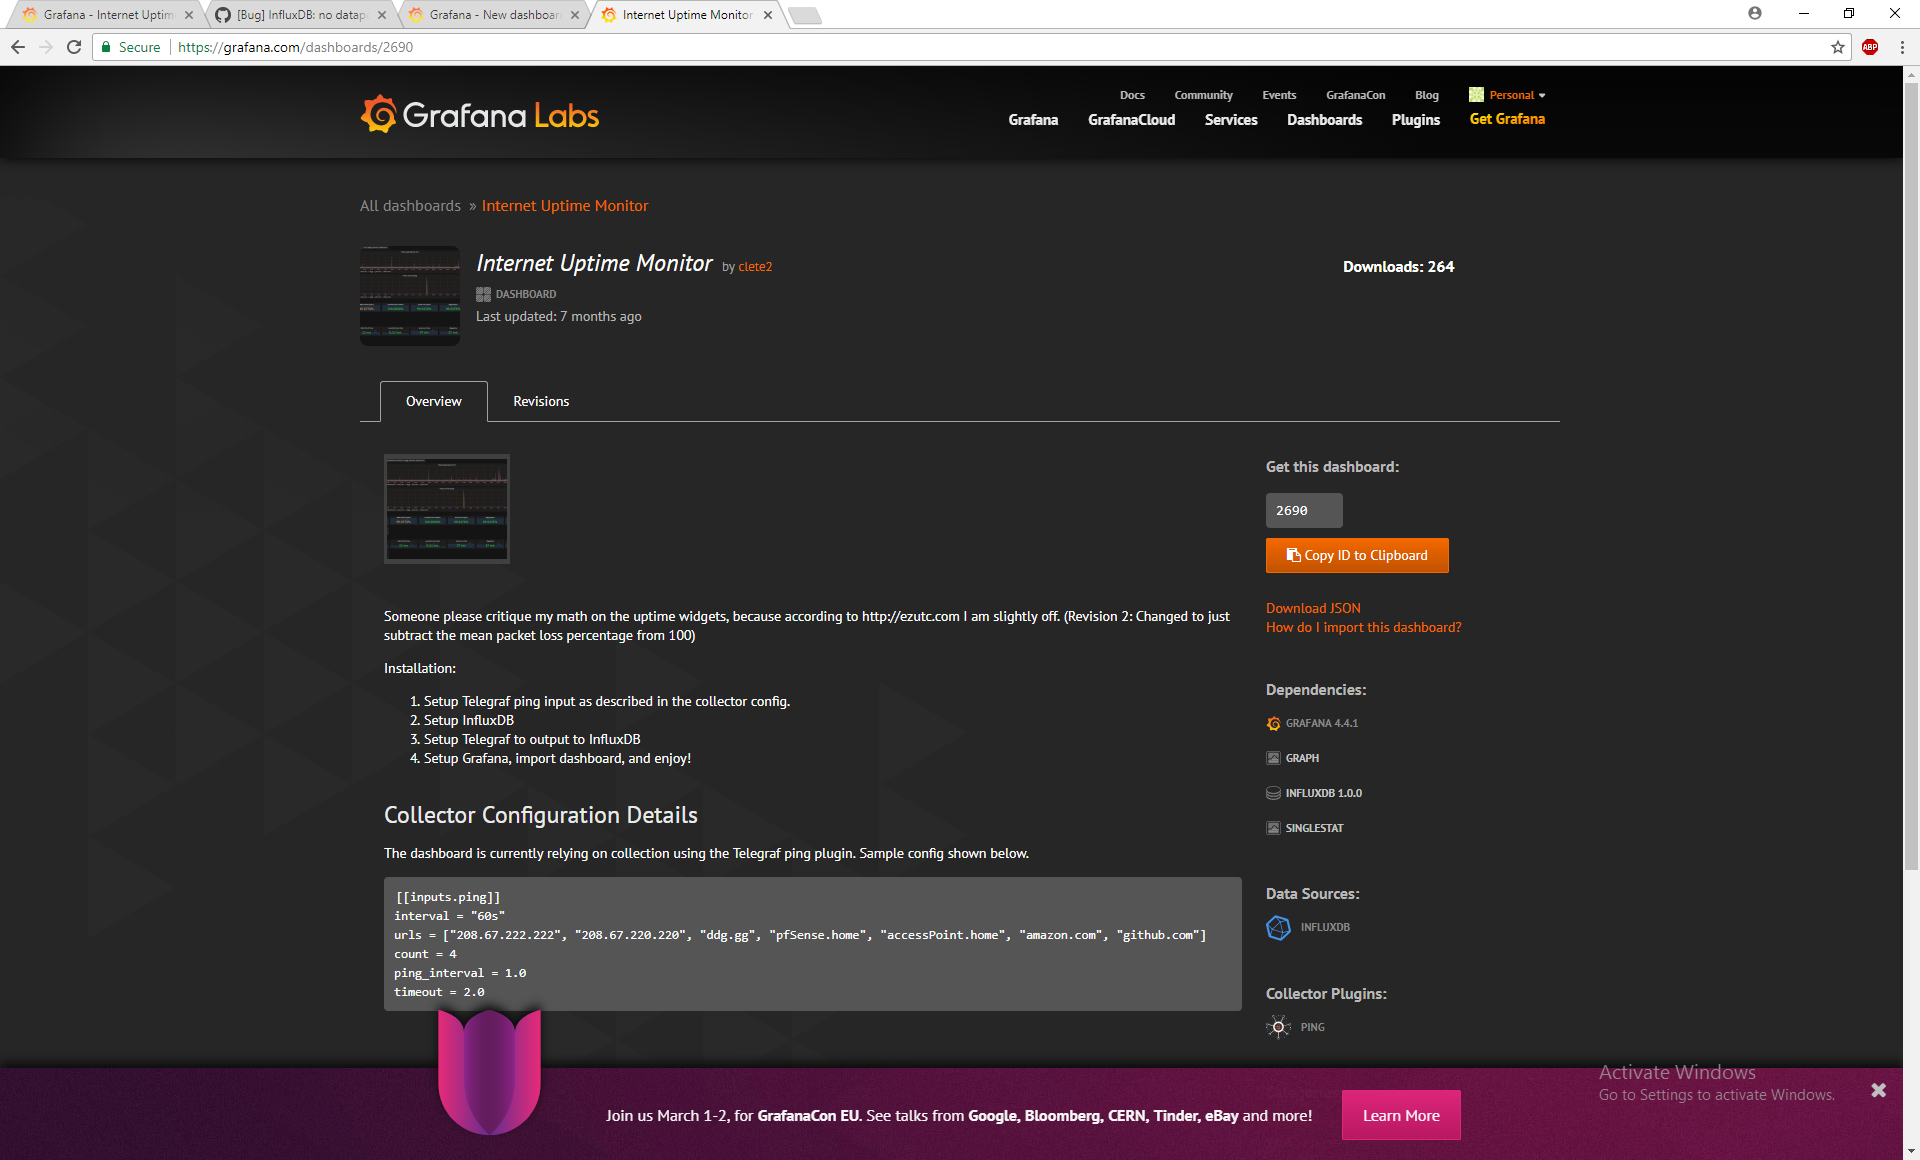
Are you using the ping Telegraf plugin and is it successfully writing data to the influx database?
Telegraf is a collector and collects data from the server you are monitoring and writes it to the InfluxDB database. If you google for a getting started guide, there are loads of blog posts as well as the InfluxDB documentation.
P.S. You can use the InfluxDB Admin plugin to explore your InfluxDB database and/or to insert some test data.
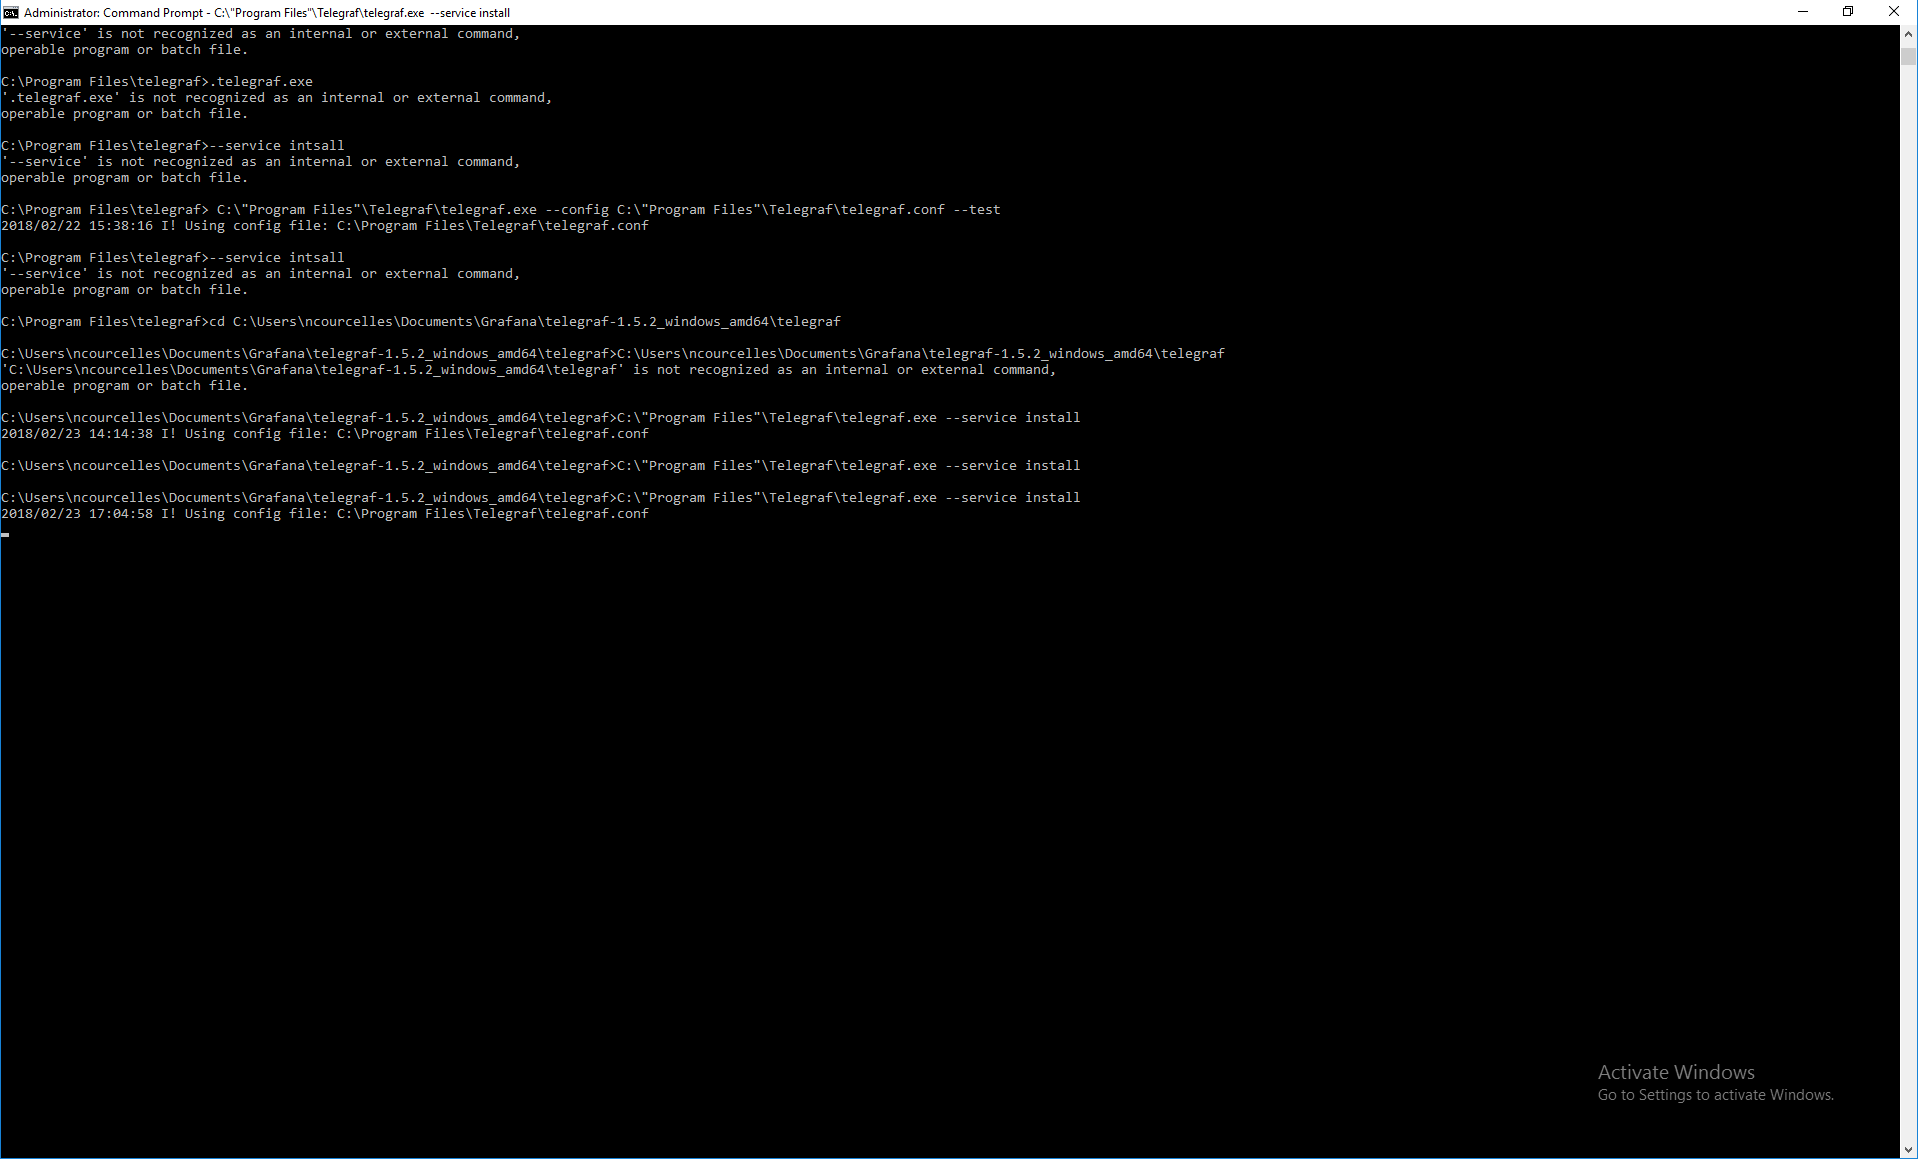
Thank you for this advice. I forgot avec adding up Telegraf as my main data writer into my InfluxDB. Hence, I’m having trouble setting it up. I tried various ways with no succes but my InfluxDB reacts a certain way when I start my telegraf.exe.
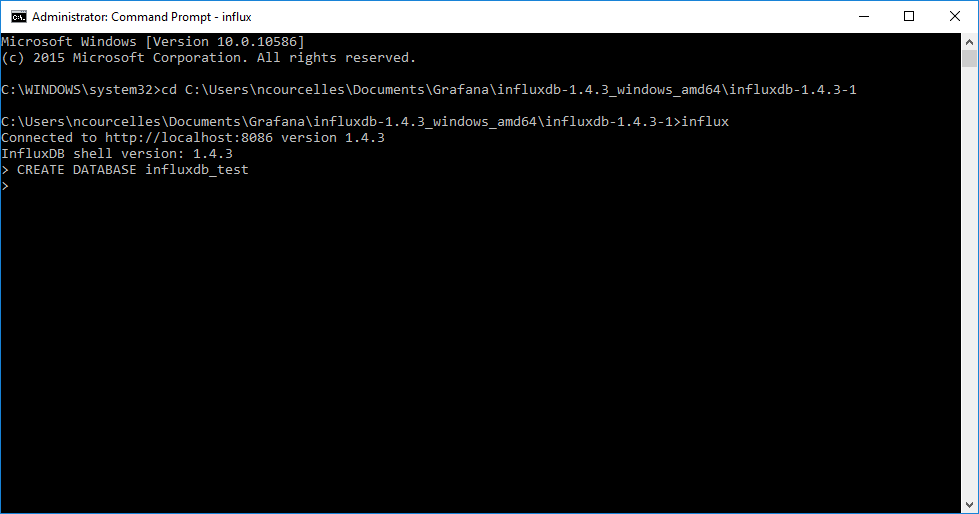
When I try to enter commands in InfluxDB I get this message :
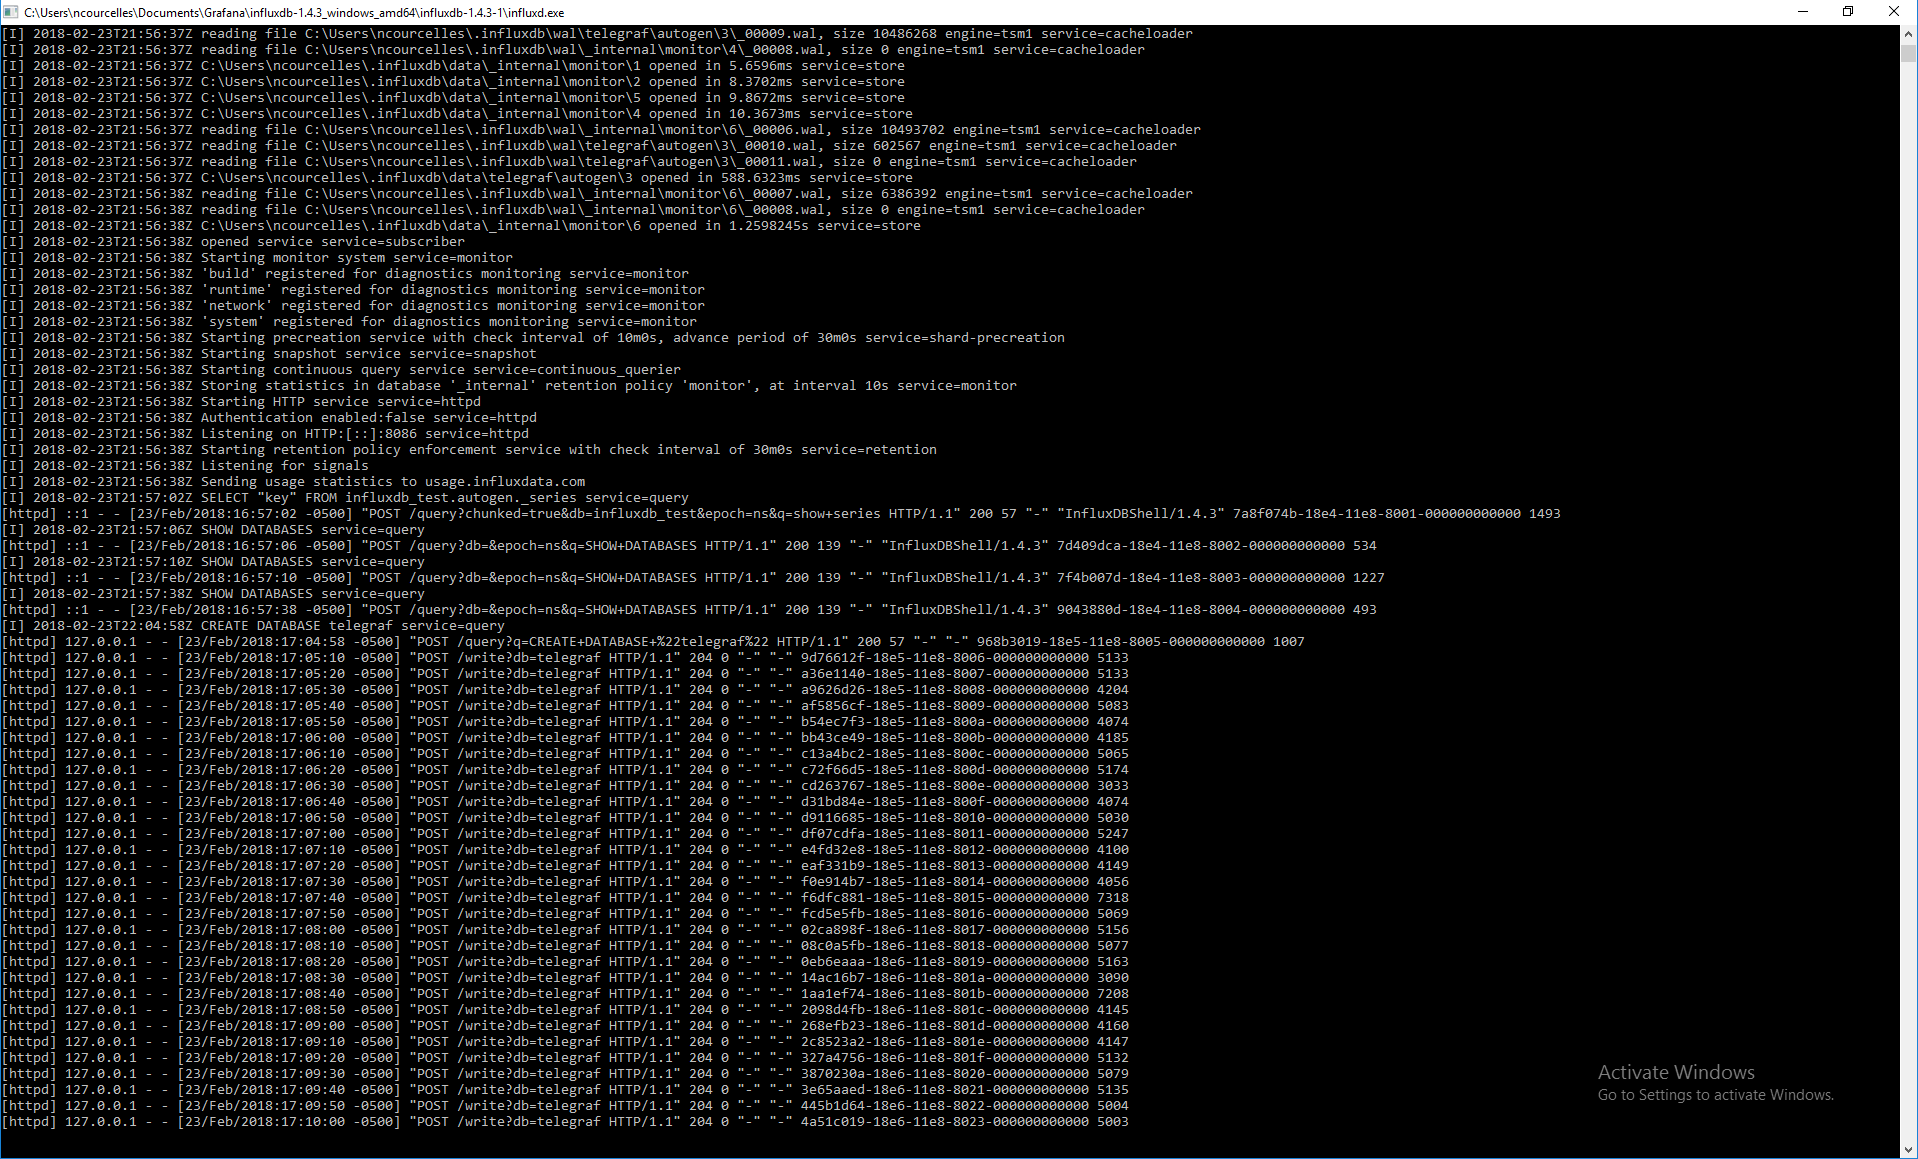
Looks like the data from the telegraf is being stored in a database called telegraf. And the influxdb_test database is empty I guess? - which is why you have no data in your dashboard.
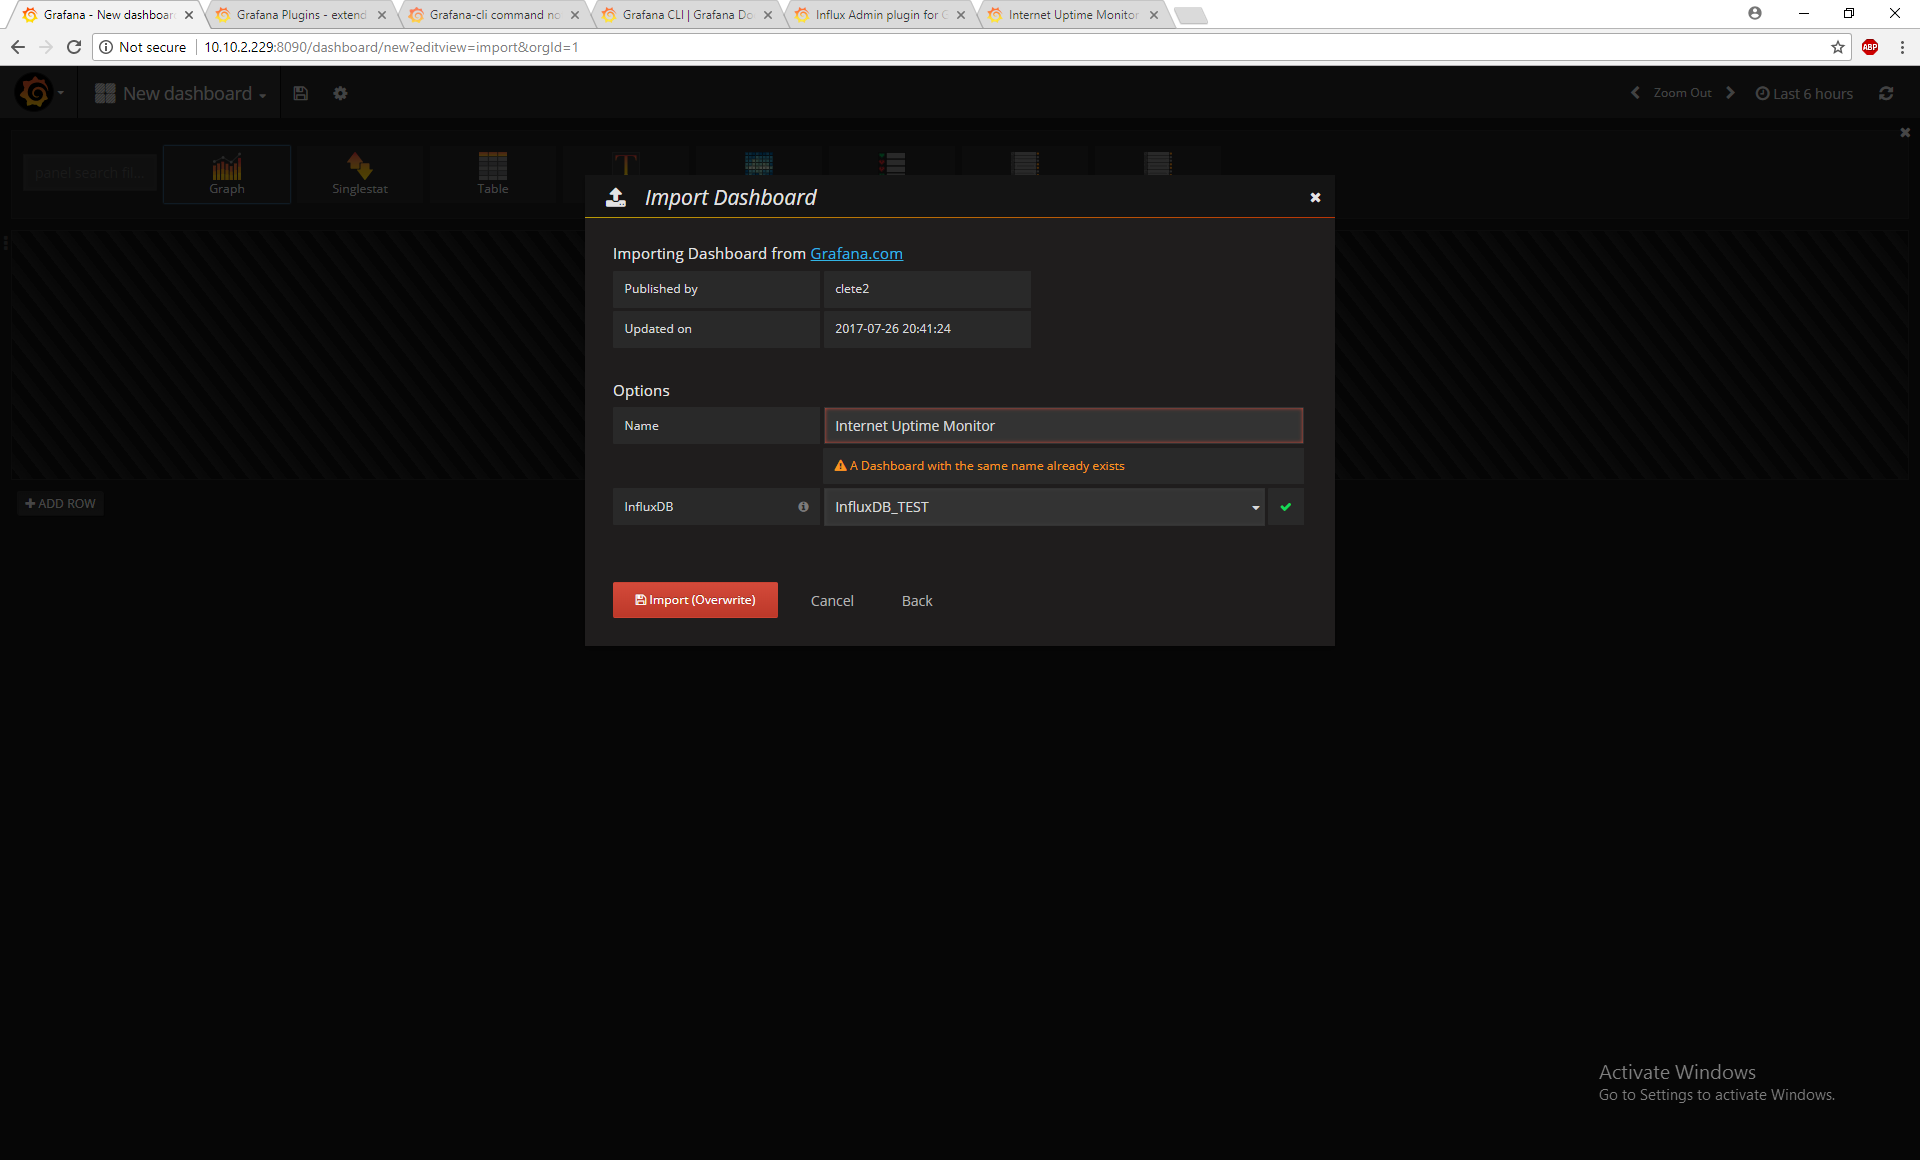
Can you change your datasource in Grafana to connect to the telegraf database instead of the influxdb_test and test if that works
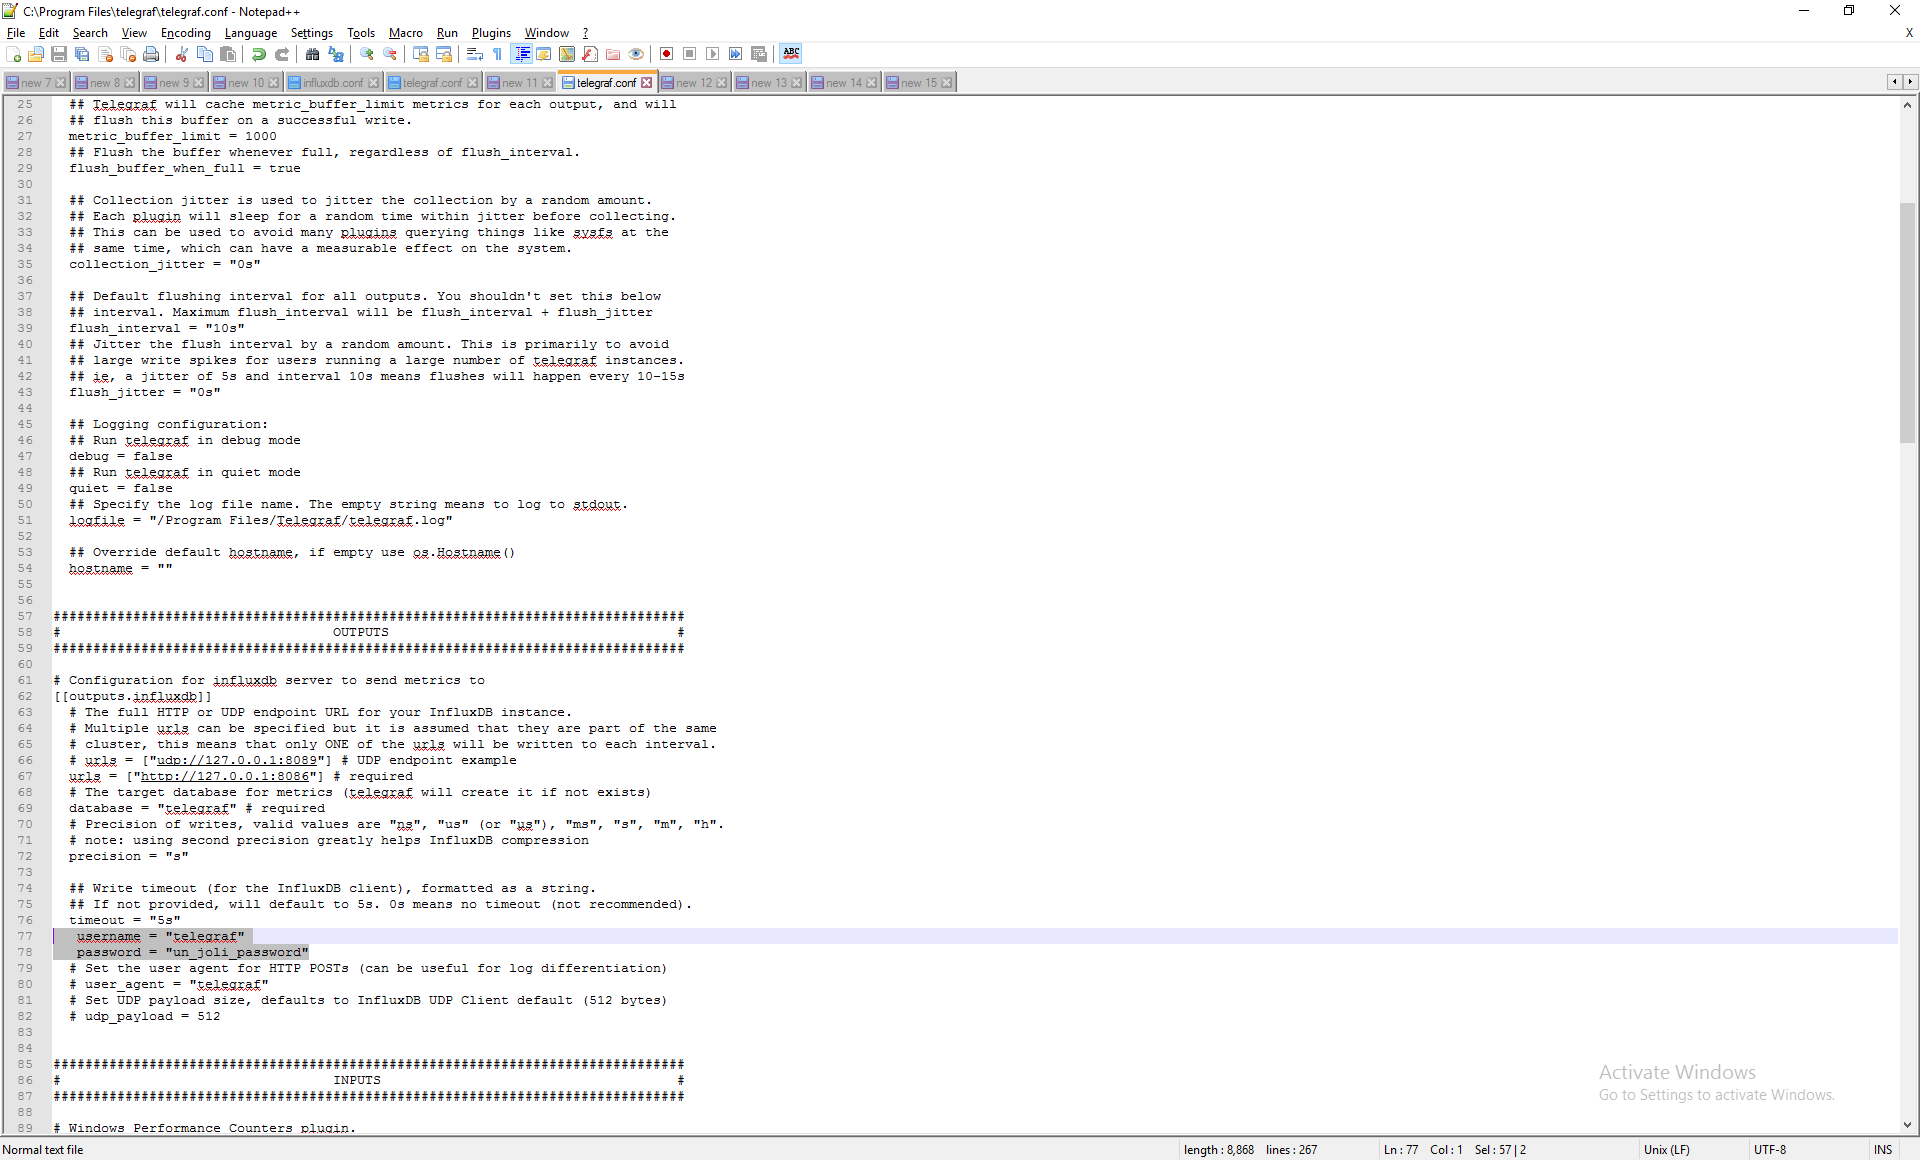
In my influxDB console. I created the db telegraf and created the user ‘telegraf’
with the password ‘un_joli_password’ and I granted the all all rights to the user
‘telegraf’ with the followings commands via the influx console :
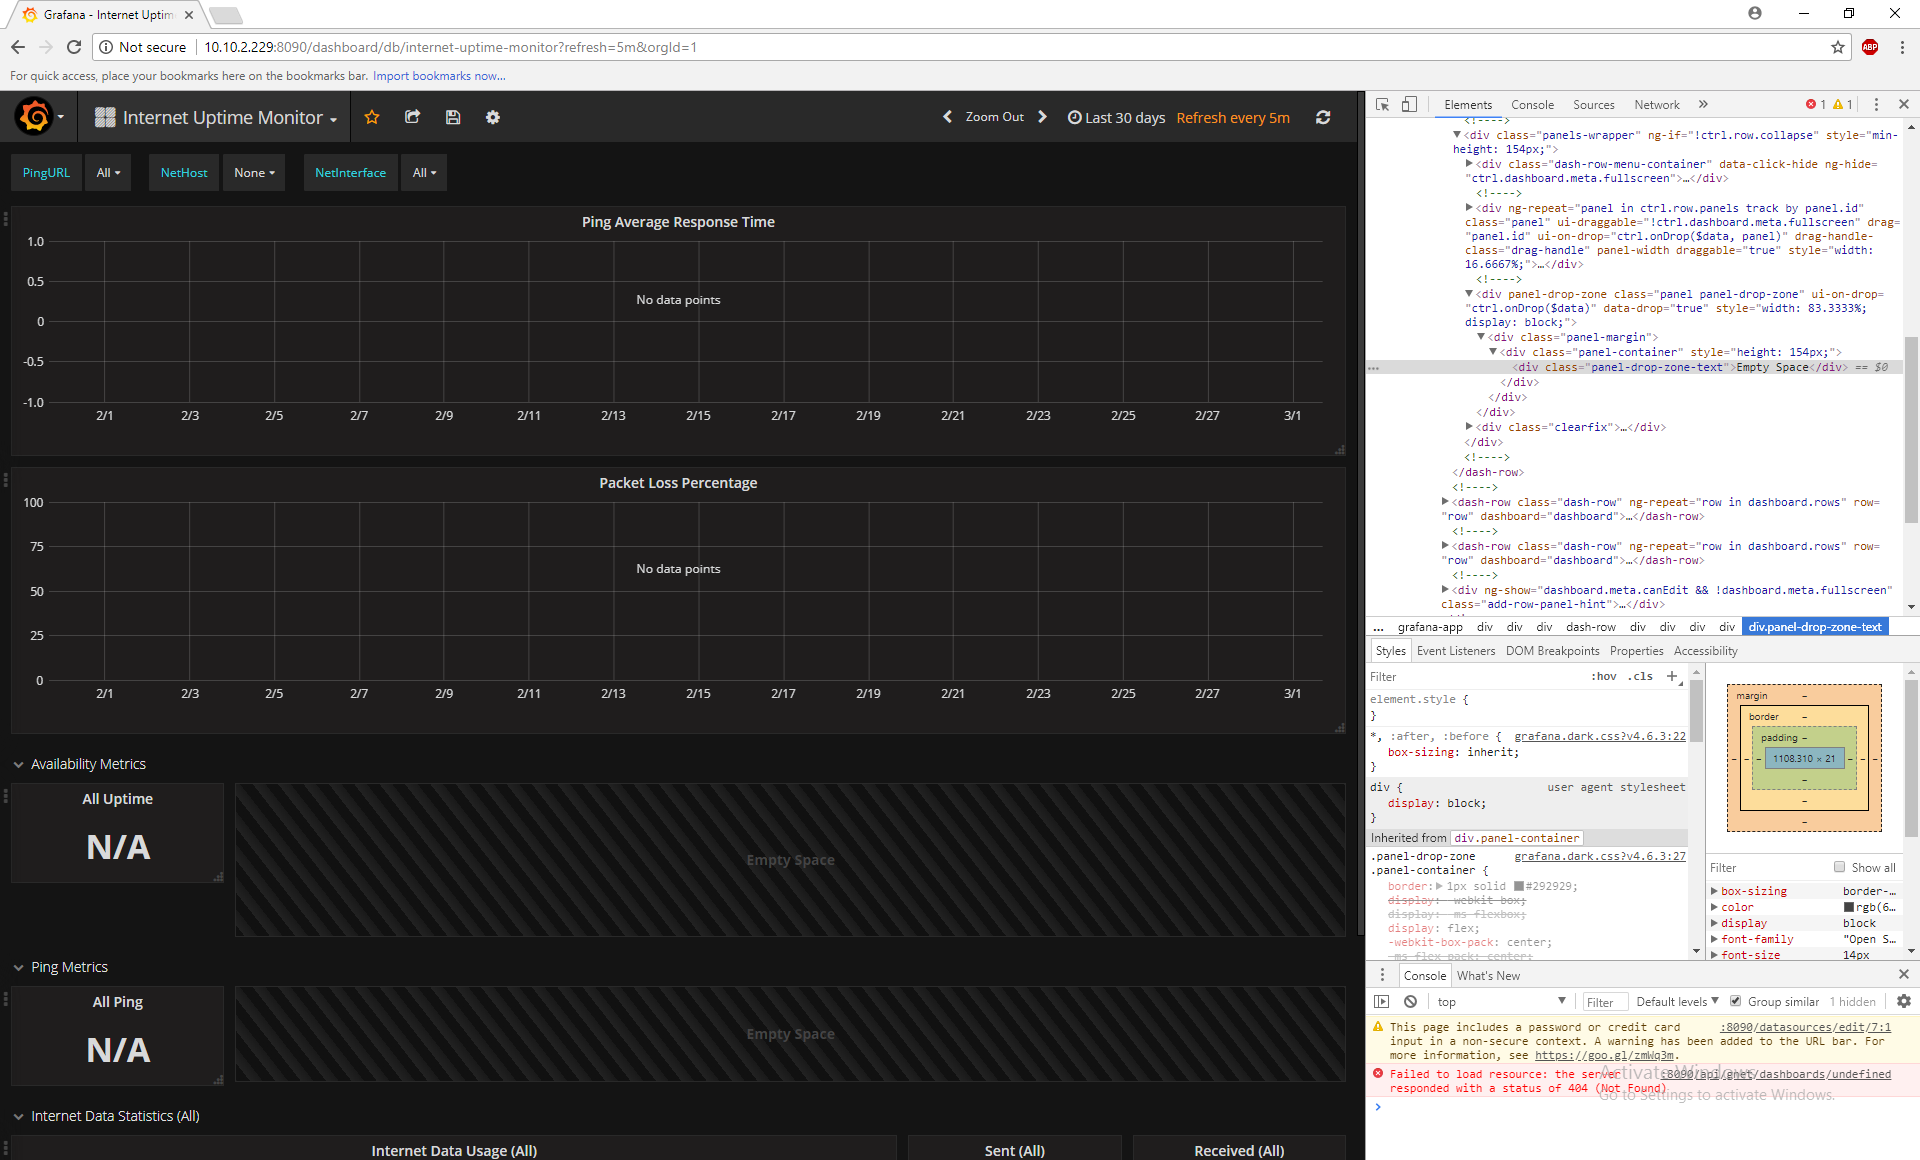
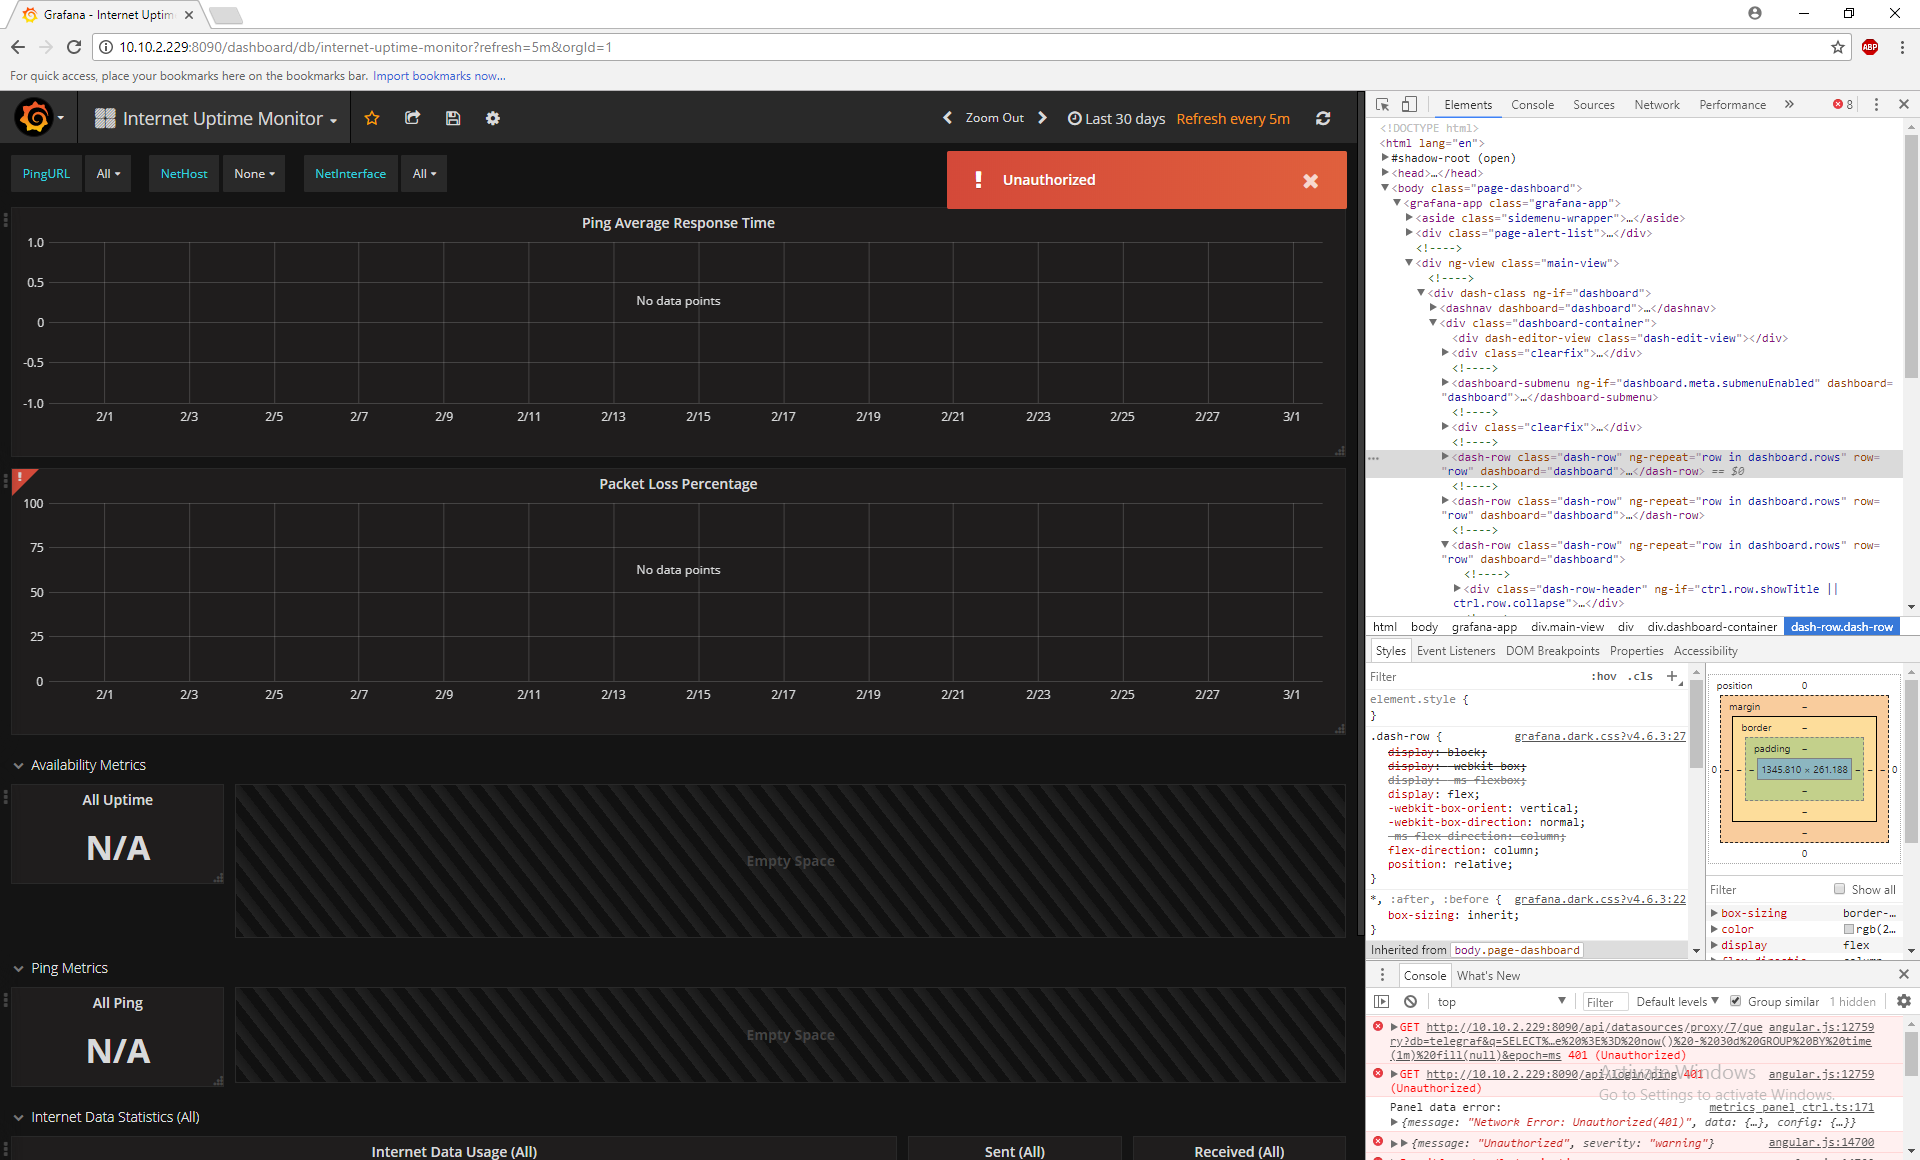
When I click on import, there’s still no data but at least the config
seems logic to me. After 5 mins and more, I have these errors in the
chrome inspect :
Not sure if it’s related. I also made sure that all the apps that I was running
were autorised by the firewall such as : influxd.exe / influx.exe / telegraf.exe
located in : Control Panel\System and Security\Windows Firewall\Allowed apps
as you send me in your video (thank you)
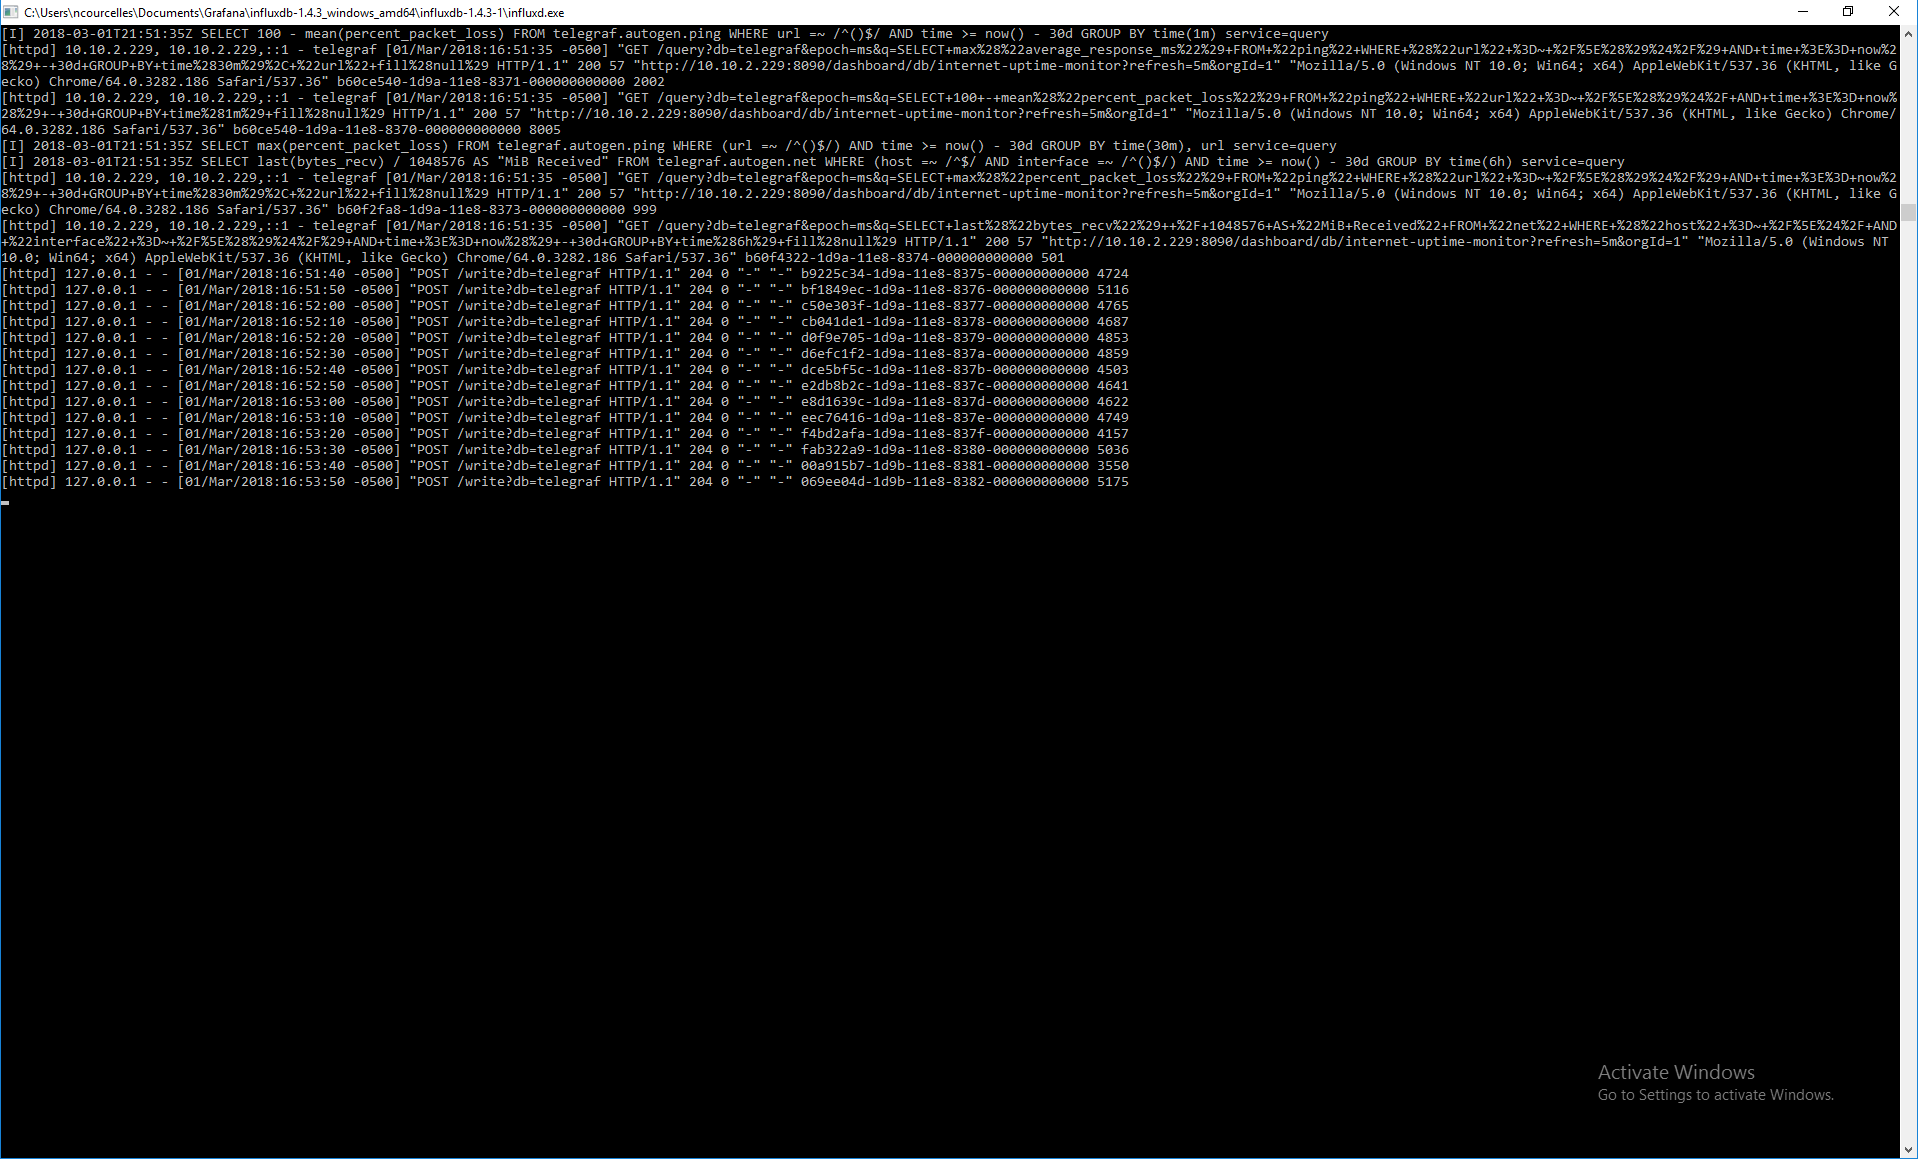
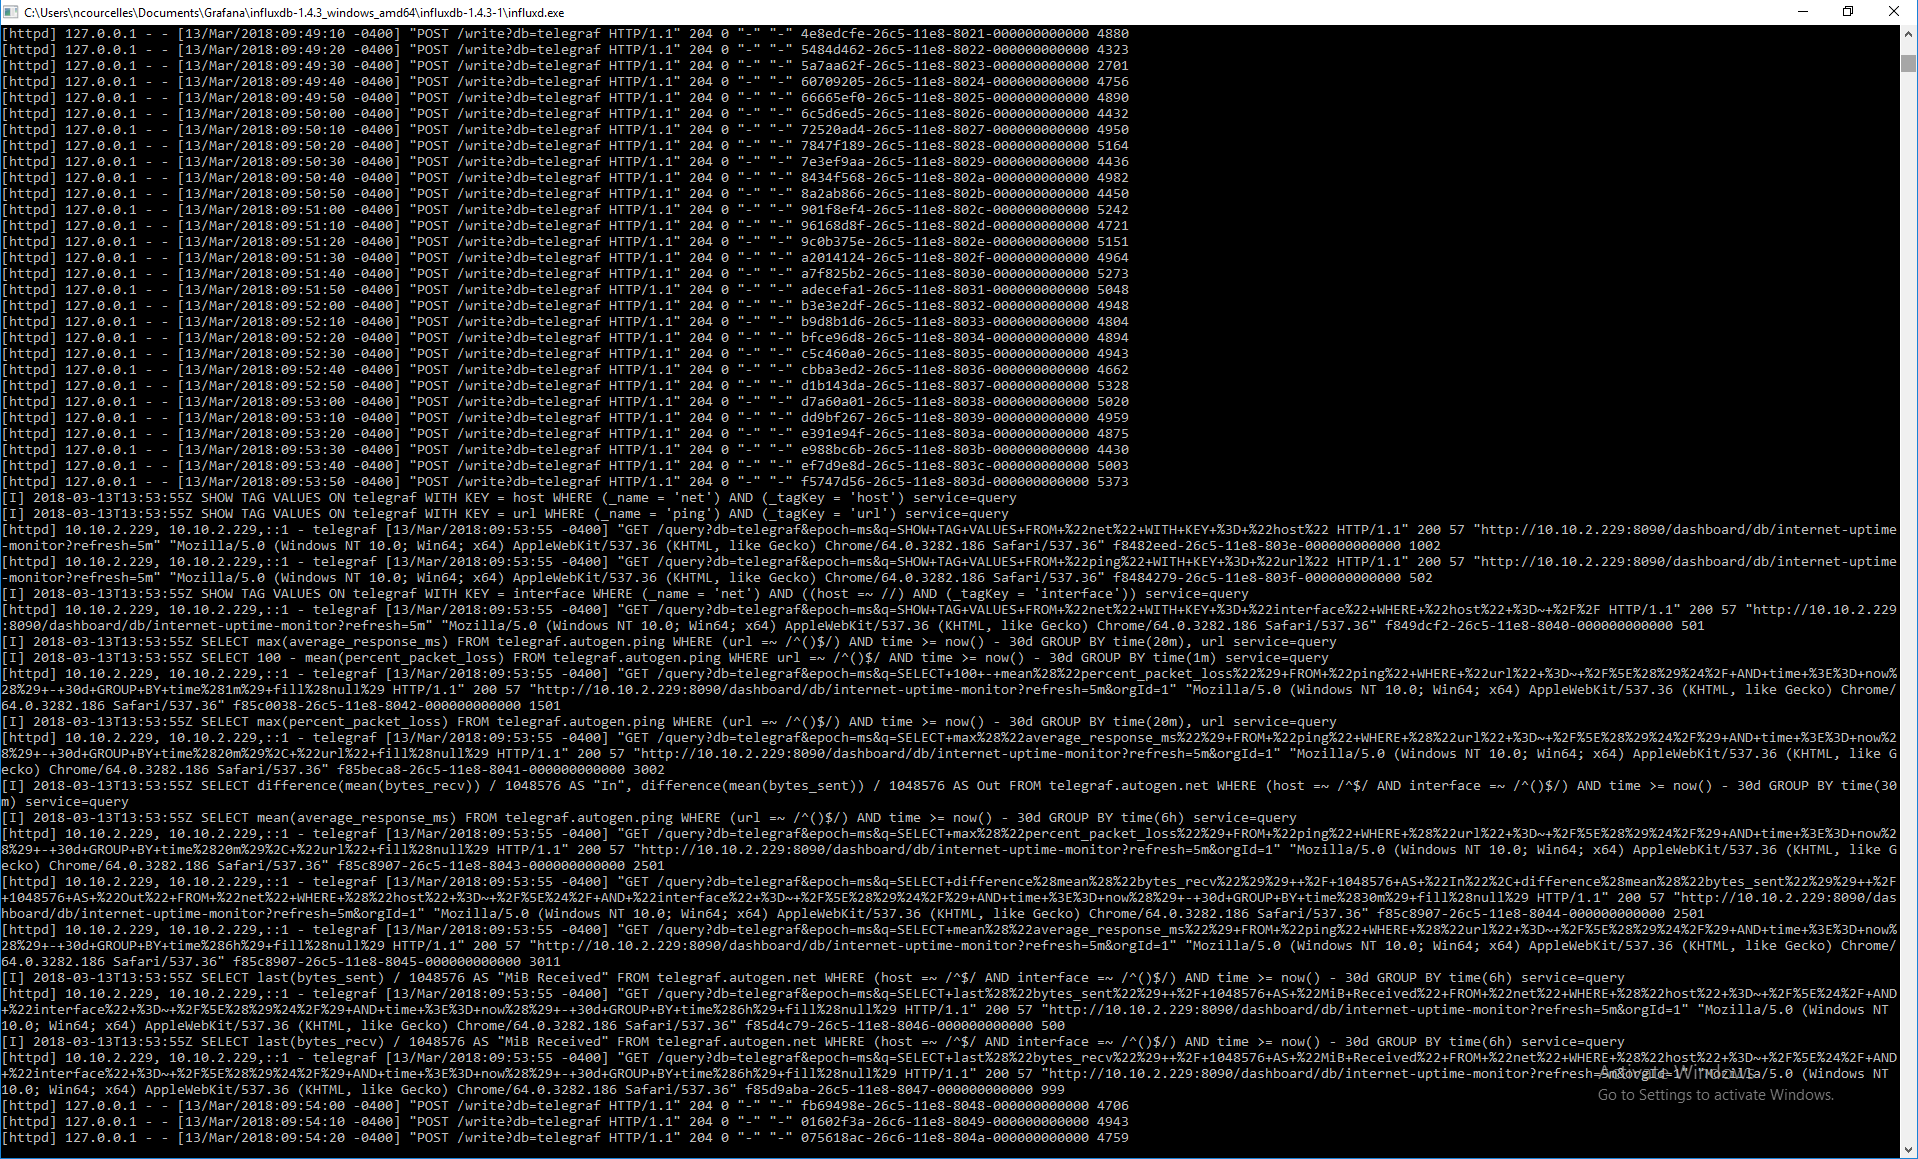
Looks like you are getting data into InfluxDB now - in the first screenshot it looks like data is being saved in telegraf.autogen.ping. Can you write a simple query and check that it has data.