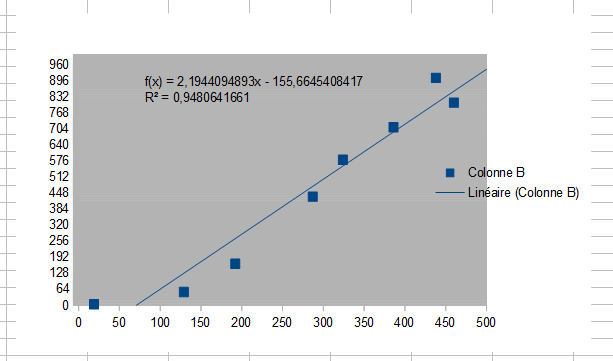
In v.12.0.0, The problem persists: the regression line is not correct because it looks like this:
When it should look like this:
{
  "id": 83,
  "type": "xychart",
  "title": "Panel Title",
  "gridPos": {
    "x": 12,
    "y": 42,
    "h": 8,
    "w": 12
  },
  "fieldConfig": {
    "defaults": {
      "custom": {
        "show": "points",
        "pointSize": {
          "fixed": 9
        },
        "pointShape": "circle",
        "pointStrokeWidth": 1,
        "fillOpacity": 50,
        "axisPlacement": "auto",
        "axisLabel": "",
        "axisColorMode": "text",
        "axisBorderShow": false,
        "scaleDistribution": {
          "type": "linear"
        },
        "axisCenteredZero": false,
        "hideFrom": {
          "tooltip": false,
          "viz": false,
          "legend": false
        }
      },
      "color": {
        "mode": "palette-classic"
      },
      "mappings": [],
      "thresholds": {
        "mode": "absolute",
        "steps": [
          {
            "color": "green",
            "value": null
          },
          {
            "color": "red",
            "value": 80
          }
        ]
      }
    },
    "overrides": [
      {
        "matcher": {
          "id": "byName",
          "options": "linear regression Z {__name__=\"Consommation\"} predicted"
        },
        "properties": [
          {
            "id": "custom.show",
            "value": "lines"
          },
          {
            "id": "custom.axisPlacement",
            "value": "hidden"
          },
          {
            "id": "color",
            "value": {
              "fixedColor": "light-red",
              "mode": "fixed"
            }
          }
        ]
      },
      {
        "matcher": {
          "id": "byName",
          "options": "Z {__name__=\"Consommation\"}"
        },
        "properties": [
          {
            "id": "unit",
            "value": "watth"
          },
          {
            "id": "custom.pointSize.fixed",
            "value": 15
          },
          {
            "id": "custom.pointShape",
            "value": "square"
          },
          {
            "id": "color",
            "value": {
              "fixedColor": "semi-dark-orange",
              "mode": "fixed"
            }
          }
        ]
      }
    ]
  },
  "transformations": [
    {
      "id": "joinByField",
      "options": {
        "byField": "Time",
        "mode": "inner"
      }
    },
    {
      "id": "regression",
      "options": {
        "xFieldName": "Meteo",
        "yFieldName": "Z"
      }
    },
    {
      "id": "formatTime",
      "options": {
        "outputFormat": "MMMM",
        "timeField": "Time",
        "timezone": "Europe/Paris",
        "useTimezone": true
      }
    }
  ],
  "pluginVersion": "12.0.0",
  "targets": [
    {
      "datasource": {
        "type": "influxdb",
        "uid": "b383168e-2097-4f5b-a983-0d137adfb3aa"
      },
      "hide": true,
      "query": "import \"timezone\"\r\n\r\noption location = timezone.location(name: \"Europe/Paris\")\r\n\r\nfrom(bucket: \"GIN\")\r\n  |> range(start: 2024-11-01T00:00:00Z, stop: 2025-07-31T00:00:00Z)\r\n  |> filter(fn: (r) => r[\"_measurement\"] == \"Consommation\")\r\n  |> filter(fn: (r) => r[\"_field\"] == \"Chauffage_chambre1\")\r\n  |> difference(nonNegative: true, initialZero: false, columns: [\"_value\"])\r\n  |> aggregateWindow(every: 1mo, fn: sum, createEmpty: false, offset: -1s)",
      "refId": "A"
    },
    {
      "datasource": {
        "type": "influxdb",
        "uid": "b383168e-2097-4f5b-a983-0d137adfb3aa"
      },
      "hide": true,
      "query": "import \"timezone\"\r\n\r\noption location = timezone.location(name: \"Europe/Paris\")\r\n\r\nfrom(bucket: \"GIN\")\r\n  |> range(start: 2024-11-01T00:00:00Z, stop: 2025-07-31T00:00:00Z)\r\n  |> filter(fn: (r) => r[\"_measurement\"] == \"Consommation\")\r\n  |> filter(fn: (r) => r[\"_field\"] == \"Chauffage_salon\")\r\n  |> difference(nonNegative: true, initialZero: false, columns: [\"_value\"])\r\n  |> aggregateWindow(every: 1mo, fn: sum, createEmpty: false, offset: -1s)",
      "refId": "B"
    },
    {
      "datasource": {
        "type": "influxdb",
        "uid": "b383168e-2097-4f5b-a983-0d137adfb3aa"
      },
      "hide": true,
      "query": "import \"timezone\"\r\n\r\noption location = timezone.location(name: \"Europe/Paris\")\r\n\r\nfrom(bucket: \"GIN\")\r\n  |> range(start: 2024-11-01T00:00:00Z, stop: 2025-07-31T00:00:00Z)\r\n  |> filter(fn: (r) => r[\"_measurement\"] == \"Consommation\")\r\n  |> filter(fn: (r) => r[\"_field\"] == \"Chauffage_chambre2\")\r\n  |> difference(nonNegative: true, initialZero: false, columns: [\"_value\"])\r\n  |> aggregateWindow(every: 1mo, fn: sum, createEmpty: false, offset: -1s)",
      "refId": "C"
    },
    {
      "datasource": {
        "type": "influxdb",
        "uid": "b383168e-2097-4f5b-a983-0d137adfb3aa"
      },
      "hide": true,
      "query": "import \"timezone\"\r\n\r\noption location = timezone.location(name: \"Europe/Paris\")\r\n\r\nfrom(bucket: \"GIN\")\r\n  |> range(start: 2024-11-01T00:00:00Z, stop: 2025-07-31T00:00:00Z)\r\n  |> filter(fn: (r) => r[\"_measurement\"] == \"Consommation\")\r\n  |> filter(fn: (r) => r[\"_field\"] == \"Chauffage_cuisine\")\r\n  |> difference(nonNegative: true, initialZero: false, columns: [\"_value\"])\r\n  |> aggregateWindow(every: 1mo, fn: sum, createEmpty: false, offset: -1s)",
      "refId": "D"
    },
    {
      "datasource": {
        "type": "influxdb",
        "uid": "b383168e-2097-4f5b-a983-0d137adfb3aa"
      },
      "hide": true,
      "query": "import \"timezone\"\r\n\r\noption location = timezone.location(name: \"Europe/Paris\")\r\n\r\nfrom(bucket: \"GIN\")\r\n  |> range(start: 2024-11-01T00:00:00Z, stop: 2025-07-31T00:00:00Z)\r\n  |> filter(fn: (r) => r[\"_measurement\"] == \"Consommation\")\r\n  |> filter(fn: (r) => r[\"_field\"] == \"Chauffage_entree\")\r\n  |> difference(nonNegative: true, initialZero: false, columns: [\"_value\"])\r\n  |> aggregateWindow(every: 1mo, fn: sum, createEmpty: false, offset: -1s)",
      "refId": "E"
    },
    {
      "datasource": {
        "type": "influxdb",
        "uid": "b383168e-2097-4f5b-a983-0d137adfb3aa"
      },
      "hide": true,
      "query": "import \"timezone\"\r\n\r\noption location = timezone.location(name: \"Europe/Paris\")\r\n\r\nfrom(bucket: \"GIN\")\r\n  |> range(start: 2024-11-01T00:00:00Z, stop: 2025-07-31T00:00:00Z)\r\n  |> filter(fn: (r) => r[\"_measurement\"] == \"Consommation\")\r\n  |> filter(fn: (r) => r[\"_field\"] == \"Chauffage_salledebain\")\r\n  |> difference(nonNegative: true, initialZero: false, columns: [\"_value\"])\r\n  |> aggregateWindow(every: 1mo, fn: sum, createEmpty: false, offset: -1s)",
      "refId": "F"
    },
    {
      "datasource": {
        "name": "Expression",
        "type": "__expr__",
        "uid": "__expr__"
      },
      "expression": "($A + $C + $D + $E + $F) * 1000 + $B",
      "hide": false,
      "refId": "Z",
      "type": "math"
    },
    {
      "datasource": {
        "type": "influxdb",
        "uid": "b383168e-2097-4f5b-a983-0d137adfb3aa"
      },
      "hide": false,
      "query": "import \"timezone\"\r\n\r\noption location = timezone.location(name: \"Europe/Paris\")\r\n\r\nfrom(bucket: \"GIN\")\r\n  |> range(start: 2024-11-01T00:00:00Z, stop: 2025-07-31T00:00:00Z)\r\n  |> filter(fn: (r) => r[\"_measurement\"] == \"Meteo\")\r\n  |> filter(fn: (r) => r[\"_field\"] == \"DJC\")\r\n  |> aggregateWindow(every: 1mo, fn: sum, createEmpty: false, offset: -1s)",
      "refId": "G"
    }
  ],
  "datasource": {
    "type": "influxdb",
    "uid": "b383168e-2097-4f5b-a983-0d137adfb3aa"
  },
  "options": {
    "mapping": "manual",
    "series": [
      {
        "frame": {
          "matcher": {
            "id": "byIndex",
            "options": 0
          }
        },
        "name": {
          "fixed": "Points"
        },
        "x": {
          "matcher": {
            "id": "byName",
            "options": "Meteo {__name__=\"Meteo\", name=\"Meteo\"}"
          }
        },
        "y": {
          "matcher": {
            "id": "byName",
            "options": "Z {__name__=\"Consommation\"}"
          }
        }
      },
      {
        "frame": {
          "matcher": {
            "id": "byIndex",
            "options": 1
          }
        },
        "name": {
          "fixed": "Régression"
        },
        "x": {
          "matcher": {
            "id": "byName",
            "options": "linear regression Meteo"
          }
        },
        "y": {
          "matcher": {
            "id": "byName",
            "options": "linear regression Z {__name__=\"Consommation\"} predicted"
          }
        }
      }
    ],
    "tooltip": {
      "mode": "single",
      "sort": "none",
      "hideZeros": false
    },
    "legend": {
      "showLegend": true,
      "displayMode": "list",
      "placement": "bottom",
      "calcs": []
    }
  }
}