- What is your Grafana version?
: v7.0.5
telegraf version: 1.16.2 (InfluxDB)
Cloudwatch Metrics - Are you using Grafana Cloud or self-hosted Grafana?
: self-hosted - Are you using legacy alerting or Unified Alerting?
: legacy alerting (maybe) - was the alert in question migrated from the legacy platform into Unified Alerting, or did you first create it inside the new platform?
: I don’t know, Alerts were created by dashboard panel.
-
What Grafana version and what operating system are you using?
: v7.0.5, I can’t access Grafana Server cause I’m not Grafana administrator. -
What are you trying to achieve?
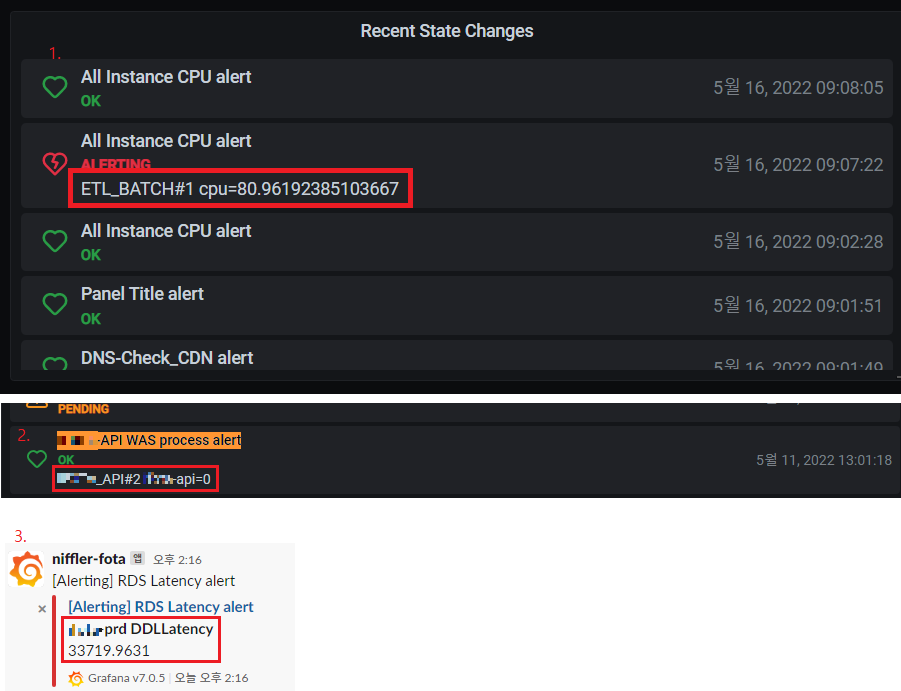
: I want to display values like below in all alert status. (server name, triggered value)
-
How are you trying to achieve it?
: I wanted to use label to display server name and triggered value before, but I don’t know how to display in name and message, because I’m grafana newbie.
however, I find that alert sometimes shows like screenshot. (That dashboard panel is ‘recent state is changed’, and it shows also in slack message which alert recieved.)
When I go into the alarm settings of that dashboard panel and look at the message, there is no sign that the value has been applied.
So I don’t know how I set those values to be displayed.
For CPU,Memory alarm, the value is displayed intermittently when the alarm trigger status is displayed, and for the process alarm, the value is displayed when the status is OK.
I want to display all the corresponding values in any state, but I can’t figure out how.
if I can shows like screenshot, I reached the goal. so I want to know how to.
(The man that worked(sets monitoring) before I arrived, I can’t contact.)