-
What is your Grafana version?
: v7.0.5
telegraf version: 1.16.2 (InfluxDB)
Cloudwatch Metrics -
Are you using Grafana Cloud or self-hosted Grafana?
: self-hosted -
Are you using legacy alerting or Unified Alerting?
: legacy alerting (maybe) -
was the alert in question migrated from the legacy platform into Unified Alerting, or did you first create it inside the new platform?
: I don’t know, Alerts were created by dashboard panel. -
What Grafana version and what operating system are you using?
: v7.0.5, I can’t access Grafana Server cause I’m not Grafana administrator. -
What are you trying to achieve?
hello.
According to the Grafana v7.3 or later official documentation, if you put a label value like ${instance} as follows, it will be reflected in Grafana Alert and each instance information will be displayed.
(In Docs: https://grafana.com/docs/grafana/latest/alerting/old-alerting/add-notification-template/)

I set it similarly which using telegraf influxdb memory query, but I want to set the label value to be visible, but I don’t know. I tried to apply the tag_host and col values to the query just in case, but it is the same.
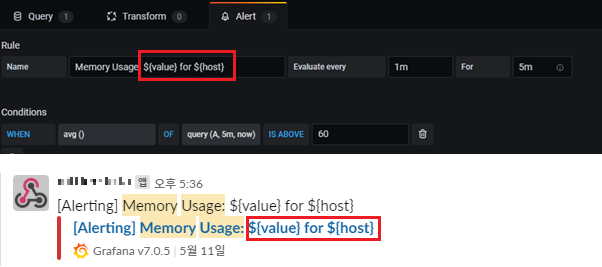
Can someone please tell me how in Grafana v7.0.5 I can display hostname and value in Alert Name. (Is this not possible in this version?)
If possible, I’d appreciate it if you could tell me how I can figure out which tags I can use.