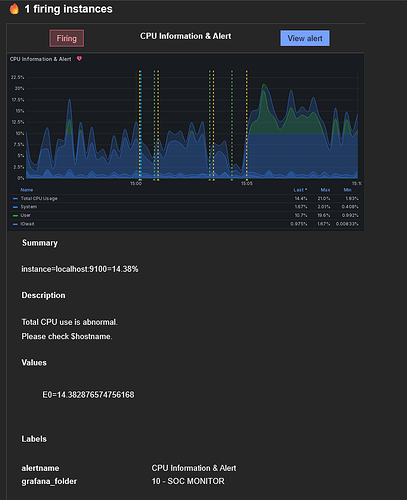
Hello,
I am using new Grafana alerting.
I am facing that when alert is fired, the legend name that i have configured on the query in not taken on alert notification like in the old Grafana alerting.
It will always take the series name
Is there a way to retrieve the original legend name like on the panel displayed or from my custom legend or how to do transformation style on alerting as “TRANSFORM DATA” does
my exemple :
the original series name : {instance=“localhost:9100”}
What I want to have in notification is : Total CPU Usage
I have configured a code following this link: Templating labels and annotations | Grafana documentation
My code:
{{ range $v := $values -}}
{{ $v.Labels }}={{ humanize ($v.Value) }}%
{{ end }}

But in mail notification, the default legend name in Value is always key ID, and in Summary it’s not changed to the display on the panel


