I want to create a variable threshold
Hello everyone
Despite reading numerous topics on the subject, such as this one Thresholds Dynamic in Graphic Time Series - #3 by grant2, I haven’t managed to achieve my goal.
I want to create a dynamic threshold on a Time Series graph. Instinctively, I created a variable with a Flux query:
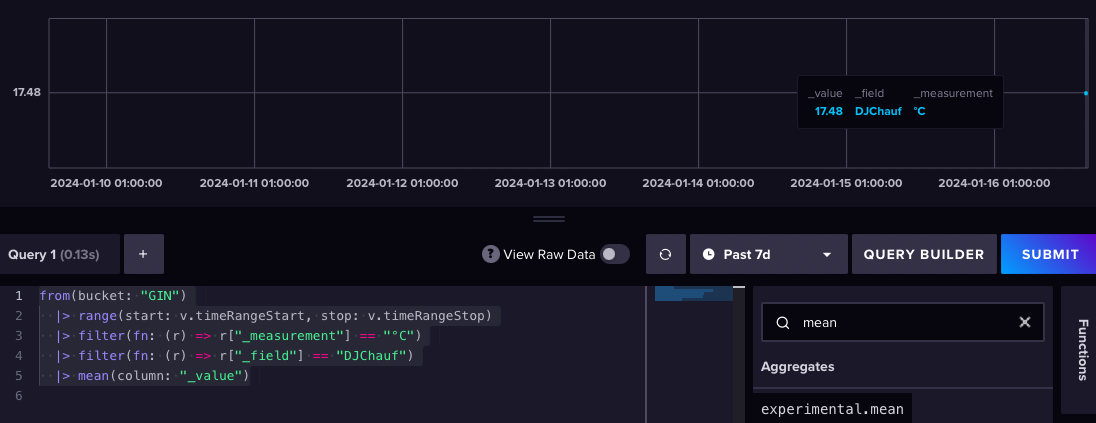
from(bucket: "GIN")
  |> range(start: v.timeRangeStart, stop: v.timeRangeStop)
  |> filter(fn: (r) => r["_measurement"] == "°C")
  |> filter(fn: (r) => r["_field"] == "DJChauf")
  |> mean(column: "_value")
Then I tried to insert it into the threshold module. But it doesn’t work.

I’d like to create a threshold line that changes depending on the window, since the average will change depending on the query.
I also have another problem with the query mentioned above.
Grafana returns
Data is missing a time field
Whereas Influx gives the average
Grafana version : v10.2.3
InfluxDB version : v2.7.4
Thank in advance.