Hello
i have some measurements about temperature all 15minutes new data.
i would like to create a Candelstick daily basis - but i only get a dotet line

have a nice day
Hi @vikozo,
Thanks for opening this post.
Did you already check the documentation regarding it i.e.
Also, found a very detailed explanation as how to use it for time-series data via this link and even though you are using InfluxDB, will still give you good information as how to make it work.
I hope this helps.
The second link does not point to the candlestick tutorial anymore.
The first link does not provide any information how to setup candlestick charts with InfluxDB. i.e. there is no information how to provide high,low,close to the chart by using Flux queries. All attempts i have tried failed.
May be someone could tell the magic?
Welcome @docb
Are you using influxql or flux query language?
hi, i am using flux as i have installed infludb2 and it seems that there is no other choice.
try something like this
from(bucket: "market")
  |> range(start: v.timeRangeStart, stop: v.timeRangeStop)
  |> filter(fn: (r) => r["_measurement"] == "market")
  |> filter(fn: (r) => r["_field"] == "close" or r["_field"] == "high" or r["_field"] == "low" or r["_field"] == "open" or r["_field"] == "volume")
   |> pivot(rowKey:["_time"], columnKey: ["_field"], valueColumn: "_value")
  |> drop(columns: ["_start", "_stop", "_measurement", "type"])
so the magic is, that it is expected that the there are fields “close” “open” etc in the line returned from influx? this is not the case, there is only a “price” value.
e.g. the high field is obtained by:
from(bucket: “crypto”)
|> range(start: 2023-11-04T12:20:00Z)
|> filter(fn: (r) => r._measurement == “ethusd”)
|> aggregateWindow(every: 1m, fn: max)
so the question is how to tell the chart that this is the high value
– and same with low, close and open (for low - fn: min, for cloese - fn:last, for open - fn: first)
please post the schema of your bucket first.
nothing special:
in the measurement is one field “price” and one tag “currency=usd”
No dates?
sure as in every measurement there is a timestamp
you can do just usd but it will be a barchart
sorry i don’t get what you are saying.
How often do you write data to your bucket?
If you have only 1 field, in order to get open,low,high,close you will obviously need 4 days worth of data if not mistaken
Or more than one entry per day
Hi @docb
In your graph above where you are displaying open/close/high/low, you are actually plotting 4 separate Flux queries, correct? Maybe share the text of each query here?
Second, as far as I can tell, the Candlestick visualization needs you to map those 4 values (open/close/high/low) into these boxes. Again, please share what you have populated here.
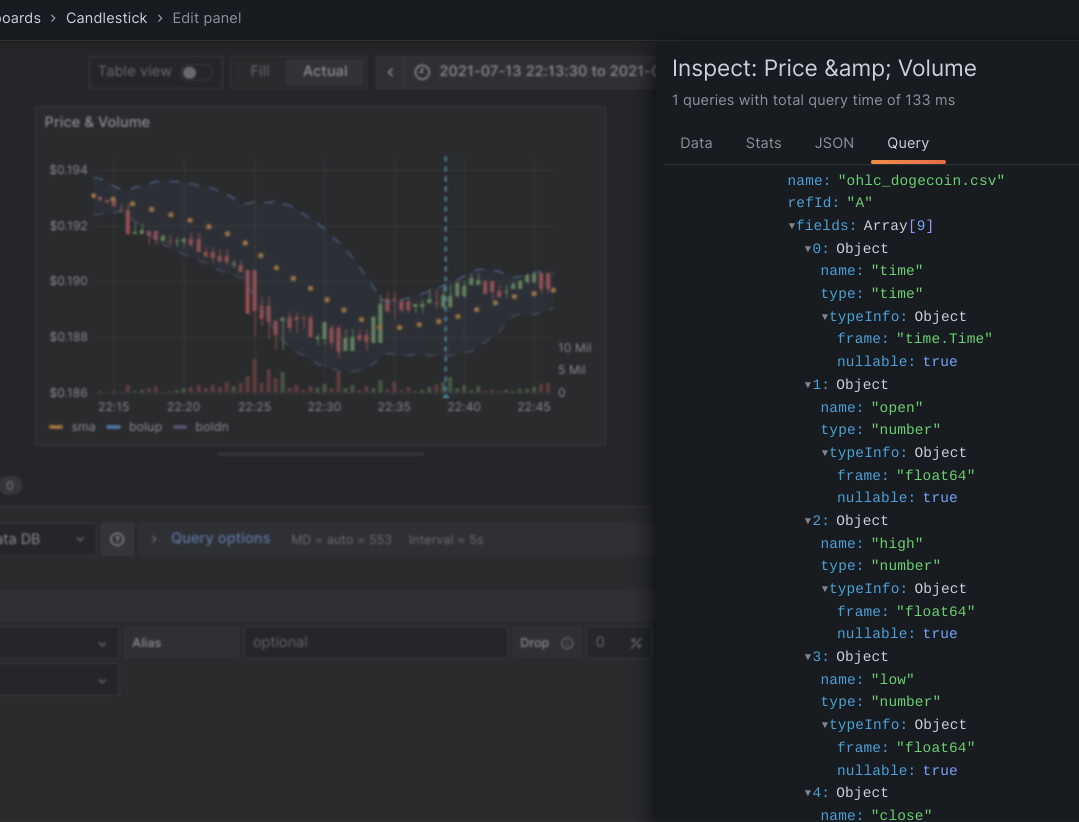
And inspecting your query should look something like this:
@grant2 I tried to do this in one flux query using multiple data catpures
low=Data
|> min()
Etc
And then union(open,low,high,close)
And got stuck there when I tried map()
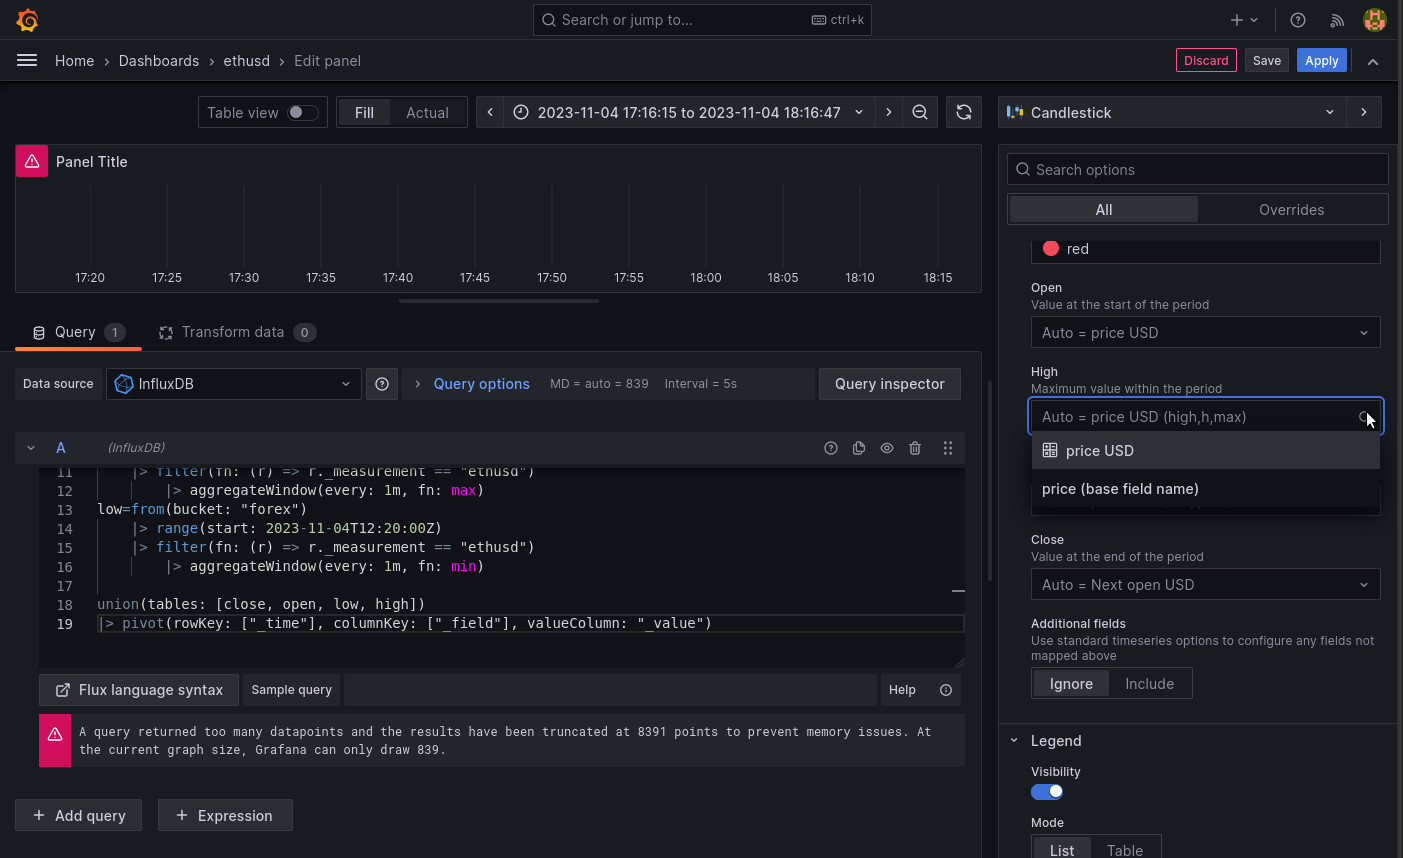
like this?
These queries give the top left panel in the image above where the display name is overridden.
Query A display override “close”
from(bucket: "forex")
    |> range(start: 2023-11-04T12:20:00Z)
    |> filter(fn: (r) => r._measurement == "ethusd")
        |> aggregateWindow(every: 1m, fn: last)
Query B display override “open”
from(bucket: "forex")
    |> range(start: 2023-11-04T12:20:00Z)
    |> filter(fn: (r) => r._measurement == "ethusd")
        |> aggregateWindow(every: 1m, fn: first)
Query C display override “high”
from(bucket: "forex")
    |> range(start: 2023-11-04T12:20:00Z)
    |> filter(fn: (r) => r._measurement == "ethusd")
        |> aggregateWindow(every: 1m, fn: max)
Query C display override “low”
from(bucket: "forex")
    |> range(start: 2023-11-04T12:20:00Z)
    |> filter(fn: (r) => r._measurement == "ethusd")
        |> aggregateWindow(every: 1m, fn: min)
Unfortunately in every attempt to map these queries to the candlestick fields failed.
There is no appropriate choice in the selection and modifying by hand also does not work.
Pretty sure that a union of the 4 queries and then a pivot function would be needed (to get the last, first, open, close into their own columns for each timestamped record).
close = from(bucket: "forex")
    |> range(start: 2023-11-04T12:20:00Z)
    |> filter(fn: (r) => r._measurement == "ethusd")
        |> aggregateWindow(every: 1m, fn: last)

open = from(bucket: "forex")
    |> range(start: 2023-11-04T12:20:00Z)
    |> filter(fn: (r) => r._measurement == "ethusd")
        |> aggregateWindow(every: 1m, fn: first)

etc.

union(tables: [close, open, low, high])
|> pivot(rowKey: ["_time"], columnKey: ["_field"], valueColumn: "_value") // modify as needed