How to skip/filter out rows with missing data?

  • What Grafana version and what operating system are you using?
    Grafana 10.0.10, Windows 10 Enterprise

Caveat: I’m new, and probably lack the terminologies to phrase my questions properly.

  • What are you trying to achieve?

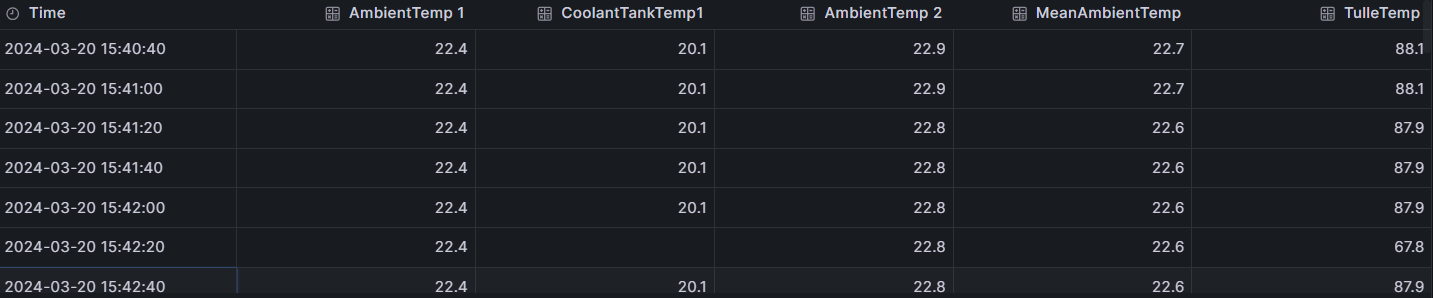
I want my panel to skip rows where there are missing sensor data, and not show them with gaps and dips as seen below when ‘CoolantTankTemp1’ fails to update at time 10:54:40 and 10:57:00. I know how to “gloss” over gaps by connecting null points in the options. However the gaps still persist in the dataset, resulting in two sharp dips when using the sensor data to calculate a new dummy-value. These dips don’t disappear by connecting nullpoints. The dips aren’t really there, and shouldn’t be visualized.

  • How are you trying to achieve it?

I though/hoped I could use ‘Join by field’ (Inner) transform to simply remove the affected rows. I realize this would be a rather brute force method, but in this case it isn’t a big deal to lose a few.

This worked when I read temperatures from two different machines and averaged the temperature between them, but not now, when I read from just one.

  • Can you copy/paste the configuration(s) that you are having problems with?
SELECT 
  time_bucket('20 sec', time) AS time, --
  part AS metric, --metric adds id-number to equal parts (sensors)
  MAX(value) --sensor readings
FROM temp --temperature dataset
WHERE
  temp.machineno = '$MachineNo' 
    AND $__timeFilter(time) 
      AND value < 30 AND value > 0
GROUP BY time, part
ORDER BY time

I̶ f̶o̶u̶n̶d̶ a̶ s̶o̶l̶u̶t̶i̶o̶n̶ by using ‘Filter data by values’ transform:

I’ll have to add the same condition to all the fields one by one though, I’d preferred a “one stroke” solution to take care of them all without having to specify which…

Edit… I’m not happy with this at all. The moment I switch to another machine with differently named sensors, the transform is simply “cleared” and rendered non-functional.

I think you don’t need filter out null values. You need to connect non null values visually:

Sorry for late reply, I’m not working every day.

Yeah no, I need a way to filter timestamps containing null data out, because connecting null points vizually only works when the data plottet contains null values, not when the data for instance is a sum of multiple values in a row, some of which are null when they should not be.

Then the result becomes the dips illustrated above, where the values are not null, but missing about 20 degrees.

I need a way to smooth that over, either with transform or perhaps preferably a “general method” in the query.

I also don’t want to delete any rows, just don’t want to plot them if they’re missing data…

Perhaps if I could figure out way to multiply the affected sums with NULL - Then the sums would become NULL and I could use ‘connect null points’ to smooth it over? Although I don’t know how to do that yet either…

How are you summing these? What is your datasource?

I dont see sum function used but I see max

Wish I could simply answer this in a short and concise manner, but…

My datasource is a local company PostgreSQL database, containing sensor readings from production machines. I don’t have in-depth understanding how it works yet… So far, I’m just pulling temperature data from it, and trying to figure out Grafana as I go, and setting up graphs the way I in my limited sense want them.

The database collects data from many machines, and each machine have several temp sensors. I select machine via a global variable that has been set up before my time (so I cannot explain that either, but basically it gives me a drop down menu on the dashboard to choose machine from, and updates the panel accordingly). ‘$MachineNo’ in the script points to the selected machine, and ‘temp’ is the table containing this machine’s temperature reads.

I have copied that variable and named it ‘MachineNo2’, so that I can select and compare two machines at once. In the panel called ‘AmbientTemp & Doubly Y-axis’ I’m displaying two machines with two queries like the one shown in the OP.

I’m summing using an ‘Add field from calculation’ transform → Mode: ‘Reduce row’ → Calculation: ‘Total’, and I’ve called it ‘TulleTemp’ (which means dummyTemp)

I just wanted a dummy value for the second Y-axis. At some point this dummy temperature will be replaced by outside temperature (at which point none of this matters, because the outside tempereature won’t be a sum of other values the way TulleTemp is), but for the time being I’d just like to learn how to avoid these kinds of visual mistakes (caused by NULL values in the data).

I wasn’t displaying all that fields that creates TulleTemp, but below I’ve added CoolantTankTemp1 which is one of them, and is the one causing the dips. Connecting nullpoint smoothes coolant tank, but not TulleTemp (Because TulleTemp is not null).

With connecting null points ON:

Without connecting null points OFF:

Sorry if all this doesn’t make any sense :sweat_smile:

1 Like

great explanation that will help us get a rounded understanding but we still have not answered the key question :wink:

So when using summation some of the values are null → is this across one row multiple columns, or across one column multiple rows?

And is one of them being null mess up the rest to be null? so you want to “eliminate” these null values so as not to mess up the summation?

1 Like

I guess it’s best if I just show you, here it is in table view:

I think the answer is “Yes” - NULL can appear anywhere in the table :joy:
‘CoolantTankTemp1’ is particularly frequently affected, but it can happen to any column at any time. I suppose it happens because the sensors fail to send data for some unknown reason. Here we can see that CoolantTankTemp has failed to report, so there’s a gap in its column, but we can safely assume that the temp has not changed.

CoolantTank being null doesn’t cause anything else to become null, but when I’m adding the values of a row together (which I think is what I’m doing), and try to vizualize this - Then the missing value in CoolantTank results in the sum being “short” one value. The sum doesn’t become null, but it becomes 20.4 less than it should be.

Therefore I think if I could either, A. skip any row where there are NULL gaps present (regardless of which column), or B: make the whole row NULL whenever there already is one or more NULL points present - then the visualization would become better and more correct than having these spikes. Missing a timestamp or two wouldn’t be much of a problem.

I think, if I could somehow achieve B, then I could simply tick ‘connect nullpoints’ again and it would look right.

that is much better to show the actual data structure with column names etc.

I would not use grafana transformation like you are which is the root cause of your problem imo.

what data type are those columns with gap data :nerd_face:

Is the data you showed the actual structure of it? if not please post the column list of the table you are selecting from including data type

I’m pretty much only using transforms as a crutch until I can properly type my own queries… Just experiementing with what they can do in the mean time :sweat_smile:

I’m not really sure what you mean by this, or what that would look like (how it would look different from the table I showed) :thinking:

ok. let’ use pictures then. which of these is what you need

Not sure… I think both would be acceptible.

I want the dips in TulleTemp filled in and connected, like so:

The table I shared before didn’t contain all the columns I use to create ‘TulleTemp’, so maybe that’s why it didn’t look right… I’ve reduced the number, so now TulleTemp is only calculated from the 4 columns before it. But the second last TulleTemp is wrong, because CoolantTank failed to report its value:

I don’t know how, but I just don’t want ‘67.8’ plotted on the graph. I wan’t it omitted and “glossed” over.

My telepathic skills are low today so can you share what your formula you used to calculte TulleTemp?

So by schema of table I mean

create table temp(
part ---is it string, varchar?,
value --is it float or decimal?,
machineno 
time

)

etc, detailing each column name and type

are these derived tables you spin up using some calculations or pivot or ??

AmbientTemp1,
CoolantTankTemp1,
AmbientTemp2,
MeanAmbientTemp

also for the gaps you can use ISNULL(temp,0) so it does not disappear. But is it really null or is it empty string, knowing the data type of columns helps sort that out

Right, I understand what you mean now… but I cannot answer what types because I don’t know. Haven’t had time/opportunity to look at the datasource “behind the curtain” yet, nor have I been shown.

I wasn’t really aware it was relevant to know these things until now. I’ll try to find out more about it, but not today - I’m beat :wink:

In any case:
AmbientTemp1, AmbientTemp2 and CoolantTankTemp1 are raw data pulled from ‘temp’, and their names come from there. They are sensors, and probably listed as ‘parts’. From what I can gather, I think ‘temp’ contains a list of machines called ‘machineno’, each machine a list of parts (sensors) called whatever the columns are called, who in turn ultimately lists all the temperature readings as some from of per timestamp value… But of what type, I cannot say…

Mean AmbientTemp is calculated from the two AmbientTemps using ‘Add field from calculation’ transform and named by me in Grafana, and TulleTemp is as mentioned also calculated by way of transform.

1 Like

I would highly recommend you do not use transformations. sleep on it

Right… And I probably won’t (eventually, in the future)… As for the moment I’m not sure why it matters…

My question is not about the transforms, it’s about how not to add rows with null in them to the table. Since the transforms are using a table that’s already queried, they ought to be irrelevant to the question. I need a query that doesn’t include those rows.

If there exists any general query methods to not include such rows (regardless of datatype and number of columns), I’d really like to know just that.

For instance, simply adding ‘WHERE value IS NOT NULL’:

WHERE
value IS NOT NULL AND
  temp.machineno = '$MachineNo' 
    AND $__timeFilter(time) 
      AND value < 30 AND value > 0

doesn’t work. Presumably because not every value of a given row are NULL at the same time - there’s always a non-null value in some of the row columns. I need help finding a more advanced/precise condition than that…

When quering the database (temp), I wan’t the resulting table to look like this:

Instead of:

Right now I’m getting the latter, because I can’t figure out how to specify the query.

1 Like

pure sql

;with not_a_grafana_issue --so as to sample your data
as
(
	select GETUTCDATE() as TimeDate, 193 as EIPCount, null as Col1, 6 Col2, 6 Col3 union all
	select dateadd(minute, -30, GETUTCDATE()) as TimeDate, 194 as EIPCount, 8 as Prog1, 6 Prog2, 6 Prog3 union all
	select dateadd(minute, -60, GETUTCDATE()) as TimeDate, 192 as EIPCount, 8 as Prog1, 6 Prog2, null Prog3 union all
	select dateadd(minute, -90, GETUTCDATE()) as TimeDate, 194 as EIPCount, 8 as Prog1, 6 Prog2, 6 Prog3

), sumall_columns as
(
select *, (SELECT SUM(v) * CASE WHEN COUNT(v) <> SUM(1) THEN NULL ELSE 1 END 
            from (
                    VALUES (Col1), (Col2), (Col3)) AS value(v)
		  ) as sumall
from not_a_grafana_issue i
)
select TimeDate, Col1, Col2, Col3
 from sumall_columns
 where sumall is not null

image