Did you find a solution for this?
I didn’t quite understand the pure sql solution by yosiasz.
Did you find a solution for this?
I didn’t quite understand the pure sql solution by yosiasz.
Unfortunately no, still struggling with it… I understand a bit more what seem to be the problem though (I think).
Just before you posted, I thought I had posted the following… However, I posted it directly into @yosiasz’s inbox instead ![]()
![]()
Hi again… I’ve been asking around elsewhere. Not much luck, but I have learned something I didn’t understand before.
Perhaps it is obvious to others, but my query produces only three columns: timestamps, values and parts. Grafana produces the rest as it pivots the table into time series format, wherein lies my problem. I need the table in time series format, but I don’t need the zeroes that gets baked back into it when the pivot happens after the query has already run.
My data comes in like this:
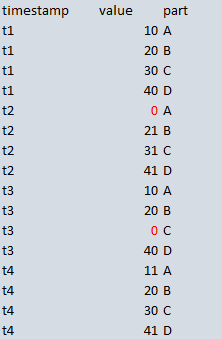
I don’t want the zeroes, so I sucessfully filter out the affected rows with WHERE value <> 0

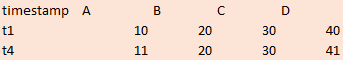
Of course I never saw this, because immediately afterwards the table pivots into this (behind the scenes automatically):

Which is the final result I cannot seem to progress beyond…
Whereas I still need the final result to look like this:
After realizing this, I thought perhaps I could run a second query on the result, and filter for WHERE value <> 0 there instead. However quering another query result doesn’t seem to be a possibility either… Or is it, and I’m just not finding it?
please provide proper DDL and DML and not images so we can do it on our database
--DDL
create table wakawaka(
process_date datetime,
value int,
part varchar(50)
)

--DML
insert into wakawaka
select '2024-04-26 08:00:00',
         30000,
         'A' --etc, providing all of the data
again this is not a grafana issue but a querying in your data source issue ![]()
I have an idea how to solve it, but I’m not sure if it’s the most optimized way to do it.
How about creating a query that gets the max number of values with the same timestamp. Then get all timestamps with that number of values to then retrieve all values with those timestamps.
Can this be done in a smarter way?
SELECT
  "time" AS "time",
  value::int,
  key
FROM metrics
WHERE
  time IN (
		SELECT
		  "time" AS "time"
		FROM metrics
		WHERE
		  $__timeFilter("time"))
		GROUP BY 1
		HAVING COUNT(*) = (
						SELECT
                          count(*)
                        FROM metrics
                        WHERE
                          $__timeFilter("time"))
                        GROUP BY time
                        ORDER BY 1 DESC
                        LIMIT 1)))
ORDER BY 1
Sorry for the late reply, I’m only able to tinker with this sporadically. Not sure though, I don’t think I’m able to test your idea out on the data I’m pulling.
However, I have finally found a solution (got some help at StackOverflow).
Basically, I can use something called CTE (Common Table Expression) to create a temporary table while “in query”… Then create two instances of this table to compare, and exclude equal timestamps if one has a value of zero… The affected timestamp gets excluded on all sensors before Grafana pivots, so no gaps gets baked back into the table. Puh, what a relief, doubt I’d have discovered CTE’s on my own any time soon…
--Creating a temporary CTE (Common Table Expression)
with temporary as(
  SELECT
    time_bucket('20 sec', time) AS time,    --
    --$__timeGroupAlias("time", '20s'),
    value,
    part as metric
  FROM temp --temperature dataset
  WHERE
    machineno = '$MachineNo2'
      AND $__timeFilter("time")
  GROUP BY time, part, value
  ORDER BY time
)
--Create two instances of CTE and compare
SELECT t1.*
FROM temporary t1
--Exclude equal timestamps if one has a value of zero
WHERE NOT EXISTS(
  SELECT 1
  FROM temporary t2
  WHERE t1.time = t2.time
    AND t2.value = 0
)
I think your solution is better because you don’t need to do multiple queries on the original database, which would make the query slower. I guess a temporary table is the way to go.
Thanks for your reply.