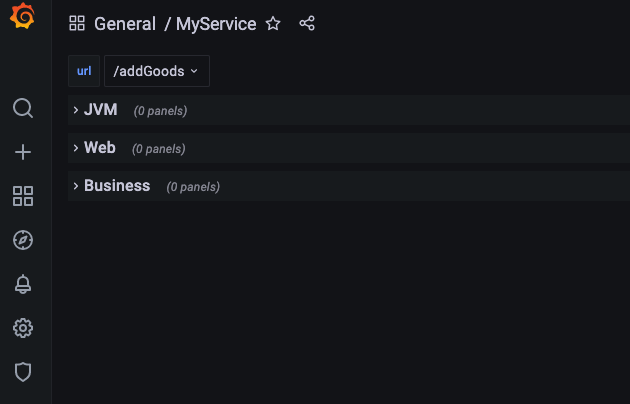
For example, I have three row and one variable in my dashboard.
But I didn’t know how to do this. Please give me some help, thanks.
easy.
example
sorry,I may not have described it clearly.
did you get the solution i’m facing same issue?
From what I can tell, it can’t be done on current versions of Grafana:
opened 08:20AM - 10 Jun 16 UTC
type/feature-request
area/dashboard/templating
I have the following use case.
- I have a set of nodes that I am monitoring
- Ea… ch nodes is one of a set of node types.
I can create template variables: node_types (containing the different node types) and nodes (containing all nodes of all types).
I want to show a graph for each node, but I want to **group** them by node type. Ideally, I would have a row repeat that repeats over each node type, and then have a panel repeat within the row that repeats over nodes **of that type**. But I don't think I can do this at the moment?
opened 09:45AM - 20 Apr 18 UTC
closed 01:57PM - 20 Apr 18 UTC
type/duplicate
Read before posting:
- Questions should be posted to https://community.grafa… na.com. Please search there and here on GitHub for similar issues before creating a new issue.
- Checkout FAQ: https://community.grafana.com/c/howto/faq
- Checkout How to troubleshoot metric query issues: https://community.grafana.com/t/how-to-troubleshoot-metric-query-issues/50
Please include this information:
### What Grafana version are you using?
5.0.4
### What datasource are you using?
InfluxDB
### What OS are you running grafana on?
SLES 12
### What did you do?
I tried to Build a Dynamical Dashboard, where i want to all Services from Multiple Hosts.
i repeat every Row by hostname and in this row i repeat a Panels by Measurement.
### What was the expected result?
i hope to get all services from a Host in a row
### What happened instead?
i get all measurements from all Hosts in a Row
### If related to metric query / data viz:
Variable
$hostname | SELECT Domain1.global_id as fqdn FROM Domain1 WHERE productive = 1
$service | show measurements where HOSTNAME =~ /$hostname$/
Panel Query
SELECT /value|max/ FROM /$service$/ WHERE "HOSTNAME" =~ /^$hostname$/ AND $timeFilter GROUP BY HOSTNAME
When i select multiple Hosts Windows,Unix etc... i get many empty panels in row with measuremnts which are not releated to the selected Hosts.
So i Suggest it would be great to get aanother template variable for Rows so i can work with multple Hosts and Services.