-
What Grafana version and what operating system are you using?
influxdb 2.7.x
grafana 10.x -
What are you trying to achieve?
i write security data to influxdb like that:
- “sca,project=project1,version=1.1,build=10 critical=0,high=5,medium=1,low=20”
- “sca,project=project1,version=1.2,build=20 critical=0,high=2,medium=0,low=15”
- “sca,project=project2,version=0.5,build=1 critical=5,high=12,medium=0,low=5”
i try to have connected plot between 1 and 2 for high field/value and show version as legend
- How are you trying to achieve it?
from(bucket: "securite")
  |> range(start: v.timeRangeStart, stop: v.timeRangeStop)
  |> filter(fn: (r) => r["_measurement"] == "sca")
  |> filter(fn: (r) => r["_field"] == "high")
  |> filter(fn: (r) => r["projet"] == "${projet}")
  |> group(columns: ["projet", "_field","version"])
  |> aggregateWindow(every: v.windowPeriod, fn: mean, createEmpty: false)
  |> yield(name: "mean")
no transformation
-
What happened?
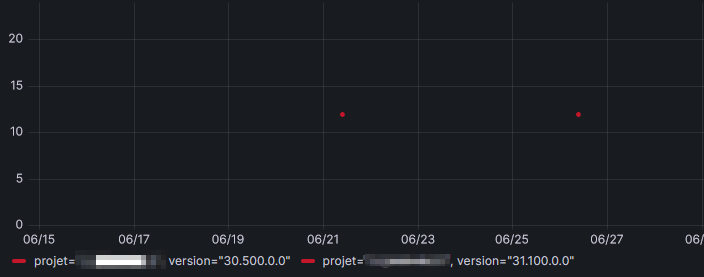
plot are not connected …
if i don’t group by “version”, plot are connected but i loose “version” information
-
What did you expect to happen?
monitors security metric by version like this modified screenshost
-
Can you copy/paste the configuration(s) that you are having problems with?
see “how” -
Did you receive any errors in the Grafana UI or in related logs? If so, please tell us exactly what they were.
no -
Did you follow any online instructions? If so, what is the URL?
no